Government
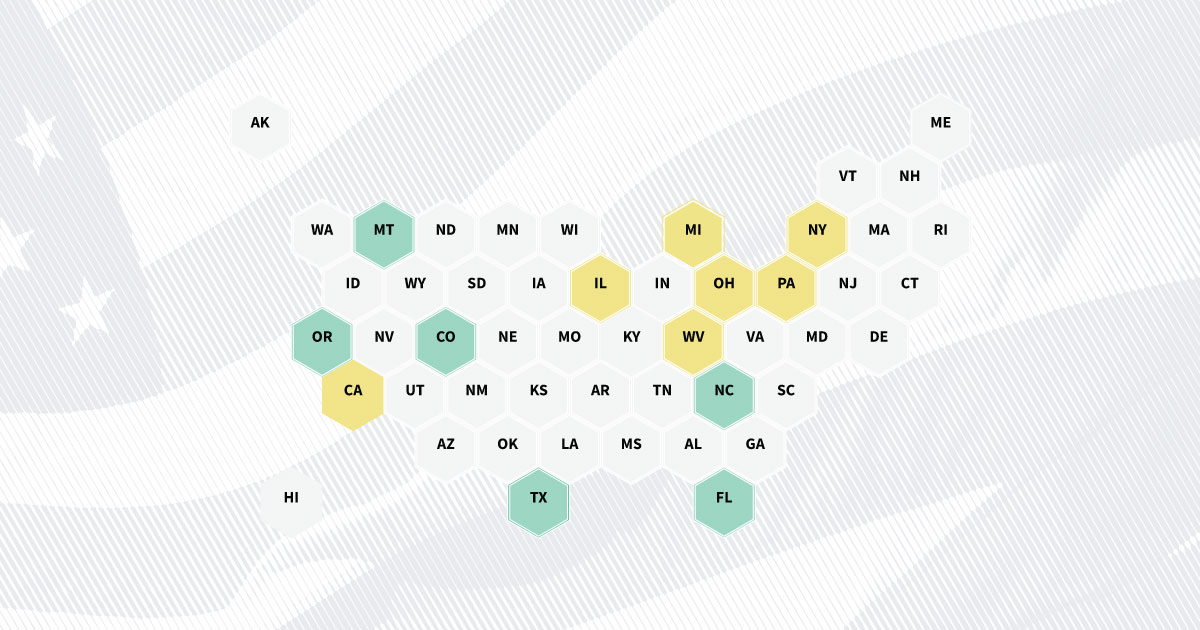
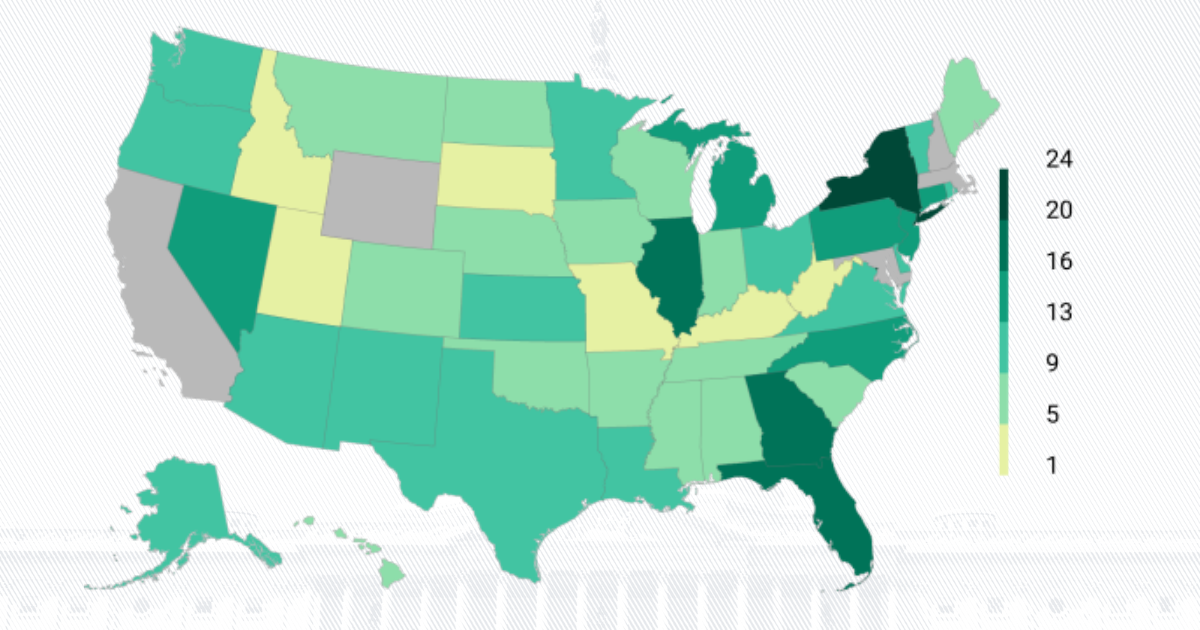
States passed a record number of restrictive abortion laws in 2021
Budget
Budget
Ninety-two percent came from individual income, payroll, and corporate income taxes.
Budget
Medicare, Social Security, defense and veterans, debt interest, plus assistance like stimulus checks and unemployment insurance accounted for 80.5% of spending. This includes funding distributed to states.
Budget
Revenue was equivalent to 17.3% of GDP, in line with the 18% annual average since 1980.
Budget
Spending was equivalent to 30% of GDP, higher than the 20% annual average since 1980.
Budget
Refundable child tax credit payments increased 175%, COVID-19 payments to Americans rose 95%, and housing assistance increased 63% due to temporary COVID-19 assistance programs. Spending for the Supplemental Nutrition Assistance Program (SNAP) and other nutritional programs temporarily grew 41% in response to the pandemic. While these increases will expire, a recent raise in the per-meal allowance not yet reflected in this data means SNAP funding will remain above pre-pandemic levels after pandemic relief funding ends.
State and local tax revenue increased 19.2% from FY2020 to FY2021 after decreasing 1.1% in the previous fiscal year. In FY2021, state and local governments accounted for 39% of government spending, 35% of which is funds transferred from the federal government. Federal transfers to state and local governments increased more than in previous years as a result of COVID-19 assistance.
Budget
The government spent 91% more than it collected in FY2020. National debt grew to $28.4 trillion last year, $22.3 trillion of which is owed to the public.
Explore the Budget Big Picture
Government
Economy
Government
Government
Government
Government
Newsletter
Keep up with the latest data and most popular content.