Environment
Air quality in the US since the passage of the Clean Air Act

Environment & Energy
Environment & Energy
Last year, the average global temperature was 0.84 °C (1.51 °F) above the 20th-century average.
Environment & Energy
In 2021, 90% of Americans lived in counties that had at least one month with extremely high temperatures compared to the 20th-century average. Forty-seven percent lived in counties with at least one month of extremely wet weather.
Environment & Energy
Wildfires burned 7.1 million acres in 2021, down 29.6% from 2020 and 4.1% above the 2010s annual average.
Environment & Energy
That's two fewer than 2020 but more than any other previous year. These disasters cost a total of $145 billion, the third-highest amount of any year with available data.
Environment & Energy
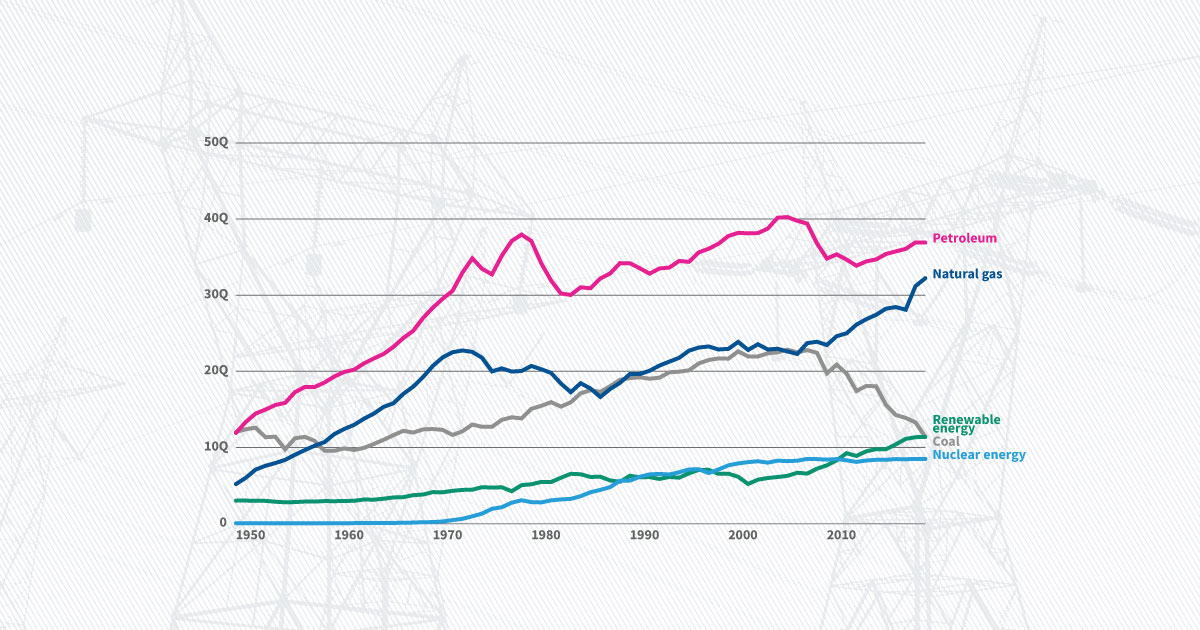
Renewable energy production grew 99.0% from 2000, faster than fossil fuel (up 33.7%) and nuclear energy (up 3.0%). Nuclear and renewables are now 20.9% of US energy production. These trends are based on preliminary 2021 data; the Energy Information Administration (EIA) will release updated 2021 data later this year.
Environment & Energy
This follows an 8.3% drop in per-person energy consumption in 2020. Energy consumption per person has fallen an average of 0.8% annually since 2000. (These trends are based on preliminary 2021 data; the EIA will release updated 2021 data later this year.)
Environment & Energy
Together, these sectors account for 60% of all US energy consumption and 66% of fossil fuel consumption. The nation's share of energy consumption from petroleum and coal dropped in 2020 but grew by 1.1 and 1.4 percentage points, respectively, in 2021. (These trends are based on preliminary 2021 data; the EIA will release updated 2021 data later this year.)
Environment & Energy
Carbon dioxide emissions increased by 7.2% compared to emissions for the same period in 2020 after an 11.0% drop in 2020. Forty-five percent of carbon dioxide emissions were from petroleum, 33.0% from natural gas, and 21.3% from coal. (These trends are based on preliminary 2021 data; the EIA will release updated 2021 data later this year.) In 2019, the US discharged 14.1% of the world’s carbon dioxide emissions, more than India and Russia, the following two highest-emitting countries, combined. Only China (10.8 billion metric tons) emitted more than the US (5.1 billion metric tons).
Explore the Environment & Energy Big Picture