Government spending
21 numbers that shaped 2021

The first 100 days of a presidential administration is traditionally a time to look back at what was accomplished in the beginning of a four-year term. President Joe Biden’s first 100 days were recently completed, shortly after his joint address to Congress on April 28. While it’s difficult to tie any specific impact to a president’s actions, government data can show what’s occurred in this short time period.
President Biden made a pledge of at least 100 million vaccinations in the first 100 days of his administration. The goal was met on his 58th day in office. The administration made a new goal of 200 million vaccinations, which was also met within the first 100 days. At least 44% of Americans have received at least one dose of the vaccine. As of January 19, the day before President Biden’s inauguration, 4% of the population had already received one dose.
The vaccine rollout has hit bumps along the way. The Centers for Disease Control and Prevention (CDC) and the Food and Drug Administration paused use of the Johnson & Johnson vaccine after six cases of blood clots were found in women who received the vaccine. At the time of the pause, Johnson & Johnson vaccines made up 9% of all vaccinations. A CDC panel voted to resume the use of the Johnson & Johnson vaccine on April 23.
The average number of coronavirus cases confirmed per day has dropped 80% since the peak of 246,127 in the week leading up to January 11, before President Biden took office. As of April 29, the seven-day average of cases was at 50,182. Deaths peaked at an average of 3,307 lives lost per day in the week leading up to January 15. The nation averaged 673 deaths per day in the last week of President Biden’s first 100 days.
Track COVID-19 numbers and the progress of the vaccination effort.
President Biden signed the American Rescue Plan Act of 2021 into law on March 11 as the first major spending bill of his administration. The Senate modified the initial $1.92 trillion House version of the bill to eliminate the provision raising the federal minimum wage to $15 an hour by 2025 and reduce other spending amounts. The plan will still cost $1.86 trillion between now and 2030, according to estimates from the Congressional Budget Office.
Direct spending will total $1.8 trillion. The largest portion of that money will go towards stimulus checks, followed by aid to state and local governments.
This is different from the $2.2 trillion CARES Act, which prioritized aid to businesses. The American Rescue Plan Act will spend $402 billion on stimulus checks, $102 billion more than the CARES Act. It will spend $362 billion in aid to state and local governments, more than double the $150 billion granted by the CARES Act.
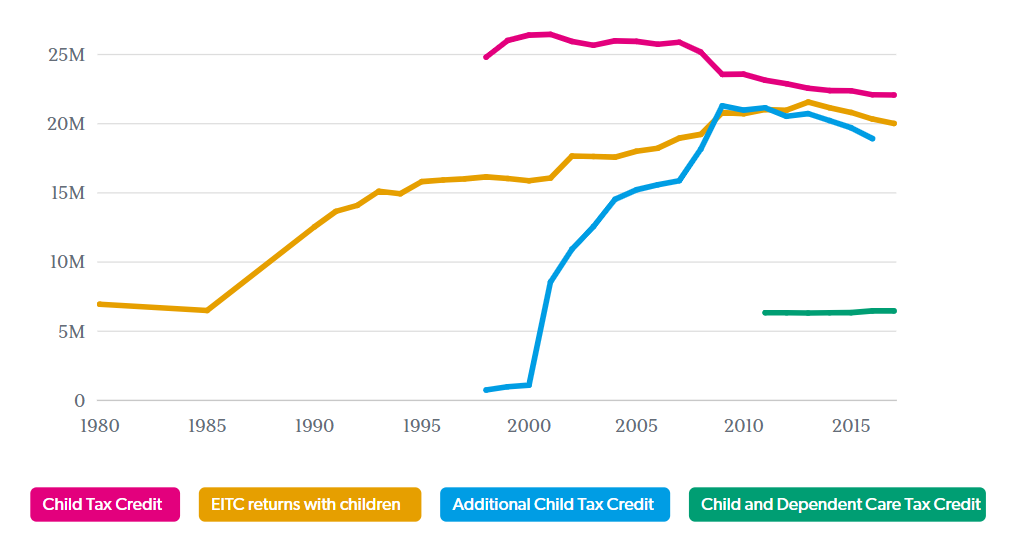
The American Rescue Plan Act also directs spending towards areas not included in the CARES Act. It allocates $89 billion to the Child Tax Credit and $58 billion to the Earned Income Tax Credit and other tax credits.
The American Rescue Plan will disburse an estimated $1.1 trillion in fiscal year 2021 — about 17% of all federal spending in fiscal year 2020 or 24% of spending in fiscal year 2019. The federal government spent 91% more than it collected in revenue in fiscal year 2020, creating a $3.1 trillion deficit. At the same time, total federal debt grew to $26.9 trillion.
During the first three months of President Biden’s time in office, the unemployment rate inched down from 6.3% to 6%, as employers added 1.4 million jobs to payrolls. Still, as of March, 9.7 million Americans were out of a job despite looking for work — that’s four million more unemployed compared to February 2020.
Since January, the largest job growth took place in the leisure and hospitality sector. Restaurants, entertainment venues, hotels, and other businesses added 664,000 jobs to payrolls between January and March, accounting for 48% of the total jobs added during the time. The sector remains hardest hit by the pandemic: in March, employment was down by 3.1 million jobs or 19% compared to February 2020.
Following leisure and hospitality, the sectors with the largest employment gains since January were trade, transportation, and utilities with 164,000 jobs added; education and health services with 158,000; and professional and business services with 144,000.
Despite economy-wide employment gains, not all groups are recovering at the same pace. In March, employment among college-educated Americans was almost back to its pre-pandemic level — down just 0.3% compared to February of last year. Meanwhile, employment was down almost 9% among high school graduates without additional schooling, and down more than 10% among those without high school degrees.
President Biden signed 42 executive orders and 10 presidential memoranda in his first 100 days. The Federal Register marked 17 of those actions as revoking one or more orders issued during the Trump administration.
President Biden signed more than half of the executive orders within a week of entering office — nine on Inauguration Day, eight the next day, and five more by January 26. He signed seven of the 10 memoranda within the first week.
The largest subset of the executive orders and memoranda signed in the first 100 days focused on the COVID-19 pandemic. President Biden mandated masks and social distancing among federal employees and on federal property, created a task force to address disparities in COVID-19 health outcomes by race, and directed departments and agencies to gather, share, and publish data on COVID-19 and the pandemic to help increase overall preparedness against biological threats.
Two other areas of focus were equality and immigration. On his first day in office, President Biden signed an executive order asking that foreign assistance and diplomacy focus on advancing the rights of LGBTQI+ people, as well as another expressing the administration’s commitment to racial equity and creating a working group to further data collection on racial disparities in the United States. Within his first week, President Biden revoked a Trump administration policy banning transgender Americans from serving in the military, condemned racism and xenophobia against Asian American and Pacific Islander communities, and affirmed tribal sovereignty for Native Americans.
President Biden signed one executive order and two memoranda on immigration in his first week. The order revoked a Trump administration policy expanding interior immigration enforcement and encouraging the restriction of federal funds for sanctuary jurisdictions. The memoranda extended a temporary immigration benefit afforded to Liberians and requested steps to fortify the Deferred Action for Childhood Arrivals program. President Biden signed another set of four orders on immigration in early February to promote naturalization and increase access to legal immigration benefits; reunify children separated from their parents at the border; create a strategy for addressing the root causes of and managing migration in North and Central America; and expand the United States Refugee Admissions Program.
Read more about federal government actions last year in The State of the Union in Numbers and get the facts every week by signing up for our newsletter.
Newsletter
Keep up with the latest data and most popular content.