Economy
Federal debts, deficits, and the effect of the COVID-19 pandemic on both

Budget
Budget
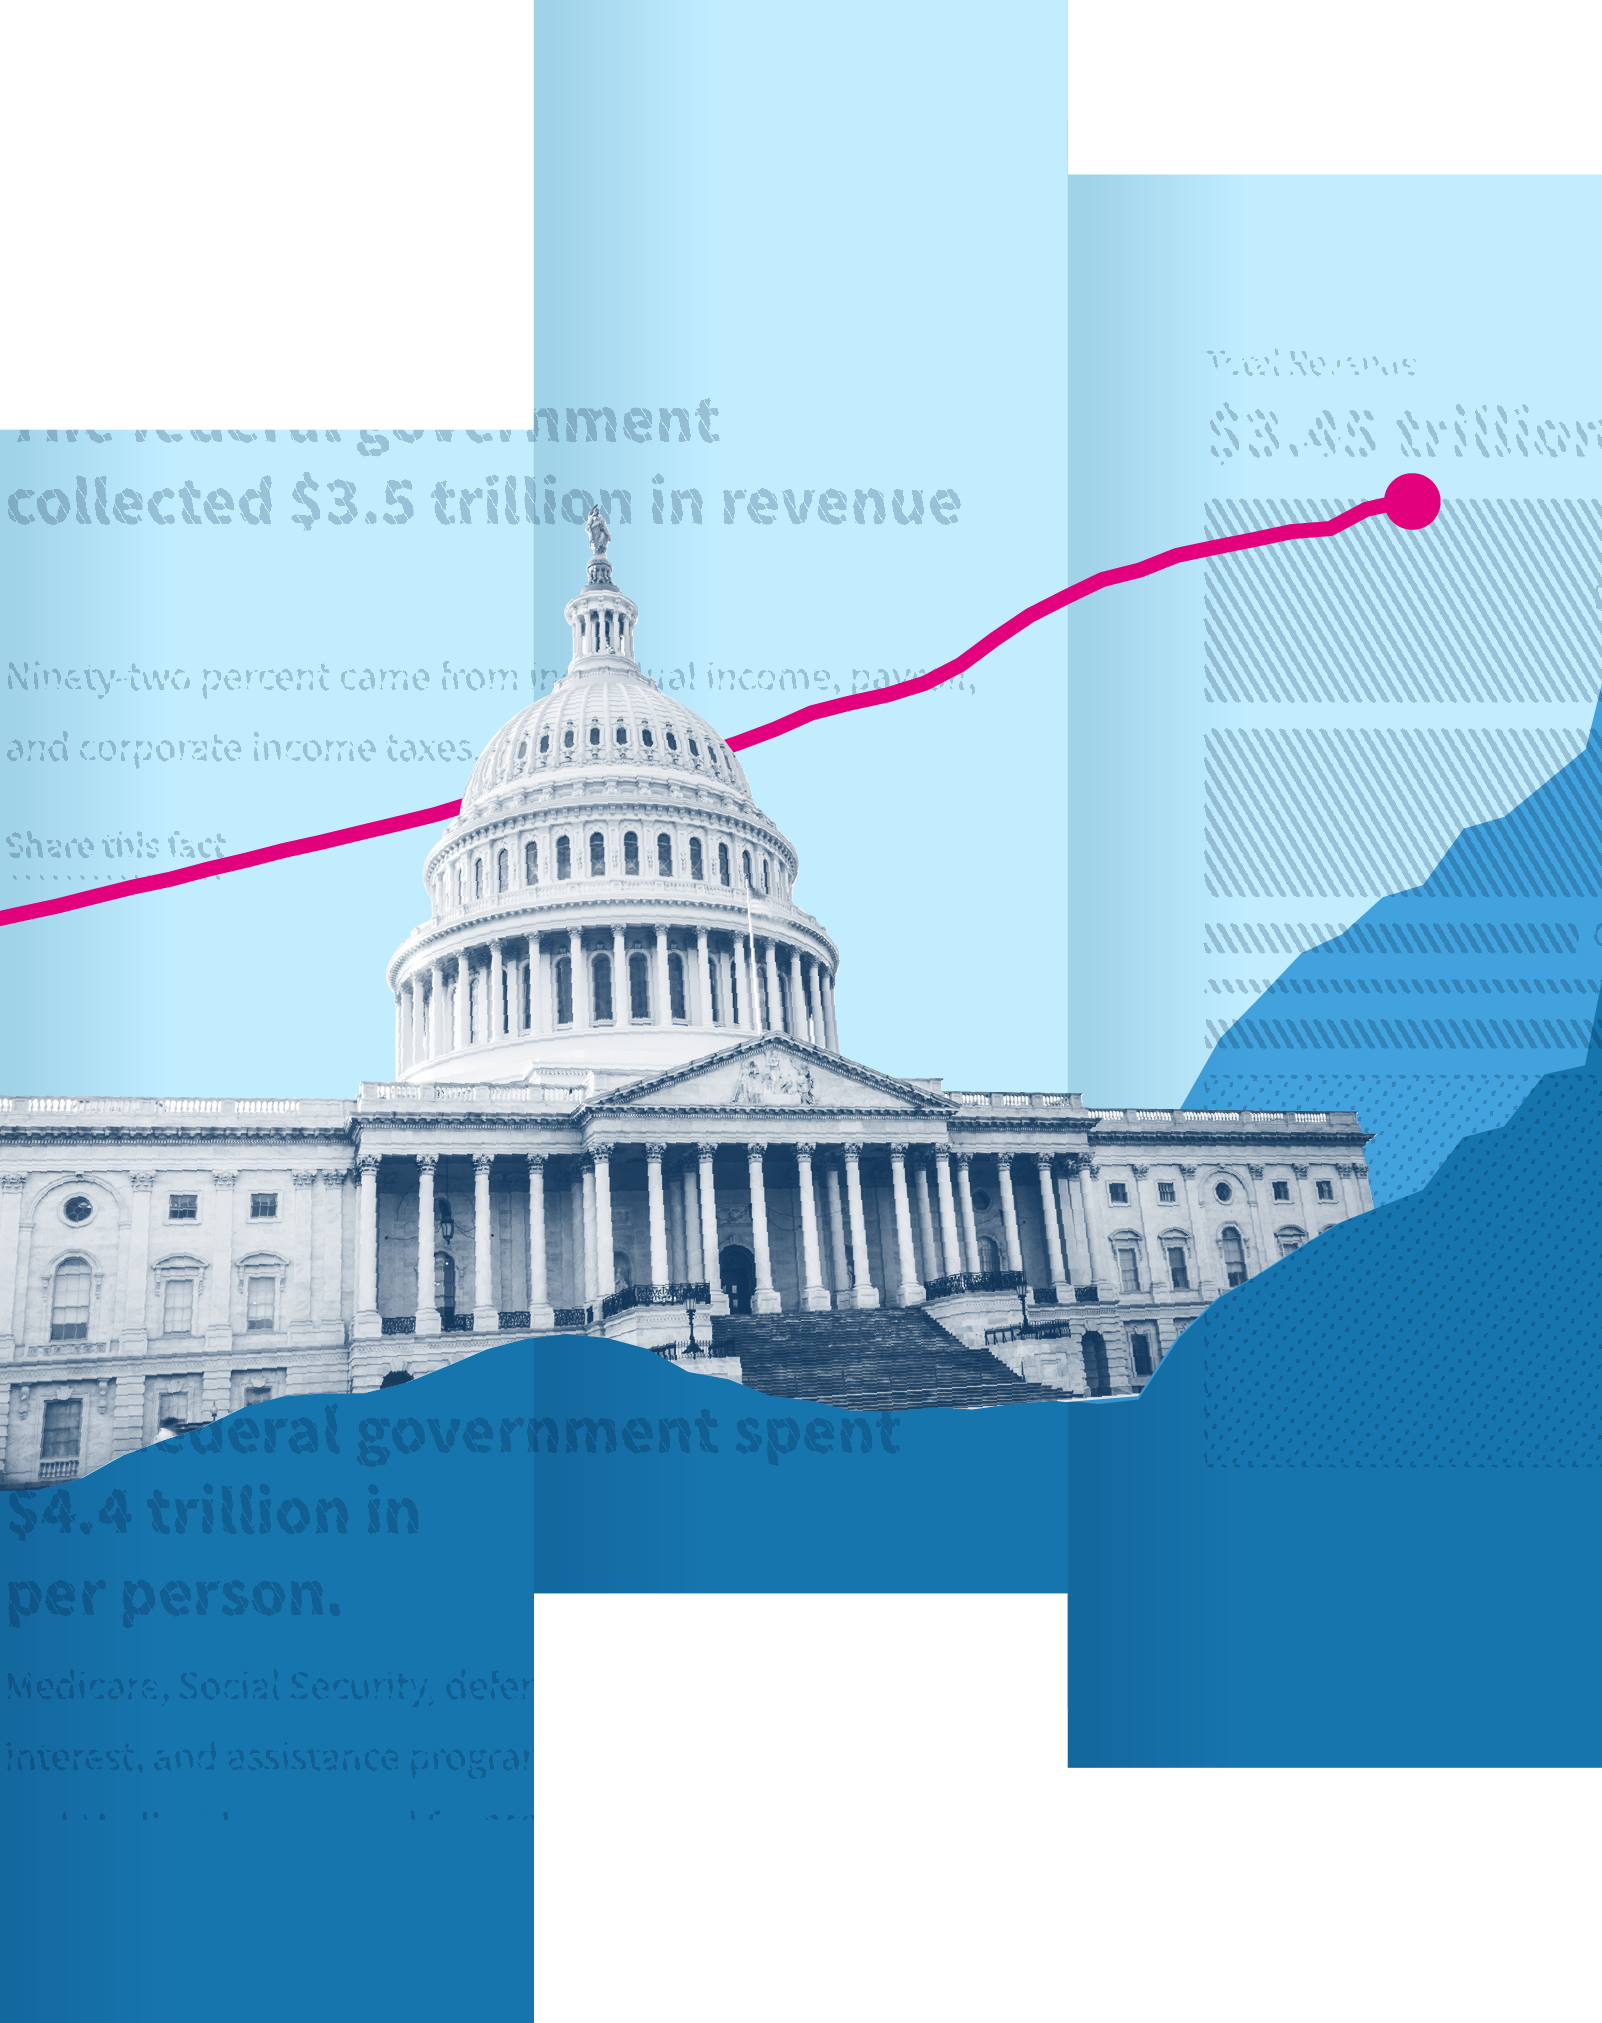
More than half was collected through individual income taxes, while 30% was through payroll taxes. Other revenue sources included corporate income taxes, sales taxes, and customs duties.
Budget
Medicare, Social Security, defense and veterans, transfers to states, and aid such as SNAP and refundable tax credits were the biggest categories, accounting for 75% of spending.
Budget
This drop was mostly due to reduced COVID-19 recovery spending for businesses and individuals. Federal spending remained 28.0% above that of FY 2019.
Budget
The deficit in FY 2021 was $3.0 trillion. For comparison, the pre-pandemic FY 2019 deficit was $1.11 trillion after adjusting for inflation.
State and local tax revenue grew 9.3% from FY 2021 to FY 2022 after rising 19% in the previous fiscal year. In FY 2022, state and local governments accounted for 41% of government spending, 33% of which were funds transferred from the federal government. Federal transfers to state and local governments were 50% higher than in FY 2019 due to COVID-19 assistance.
Budget
The federal debt held by the public is equivalent to 94.5% of GDP, similar to the 94.7% ratio of FY 2021, but higher than the average of 71.3% in the 10 years before the pandemic.
Explore the Big Picture
Economy
Economy
Economy
Economy
Newsletter
Keep up with the latest data and most popular content.