Population and society
Monthly public transit ridership is 65% lower than before the pandemic
Infrastructure
Infrastructure
Typically, half of federal transportation spending goes to highways, and around 22% goes to air transportation.
Infrastructure
In 2020, the federal government spent $63 billion directly on infrastructure and granted an additional $83 billion in infrastructure funding to states.
Infrastructure
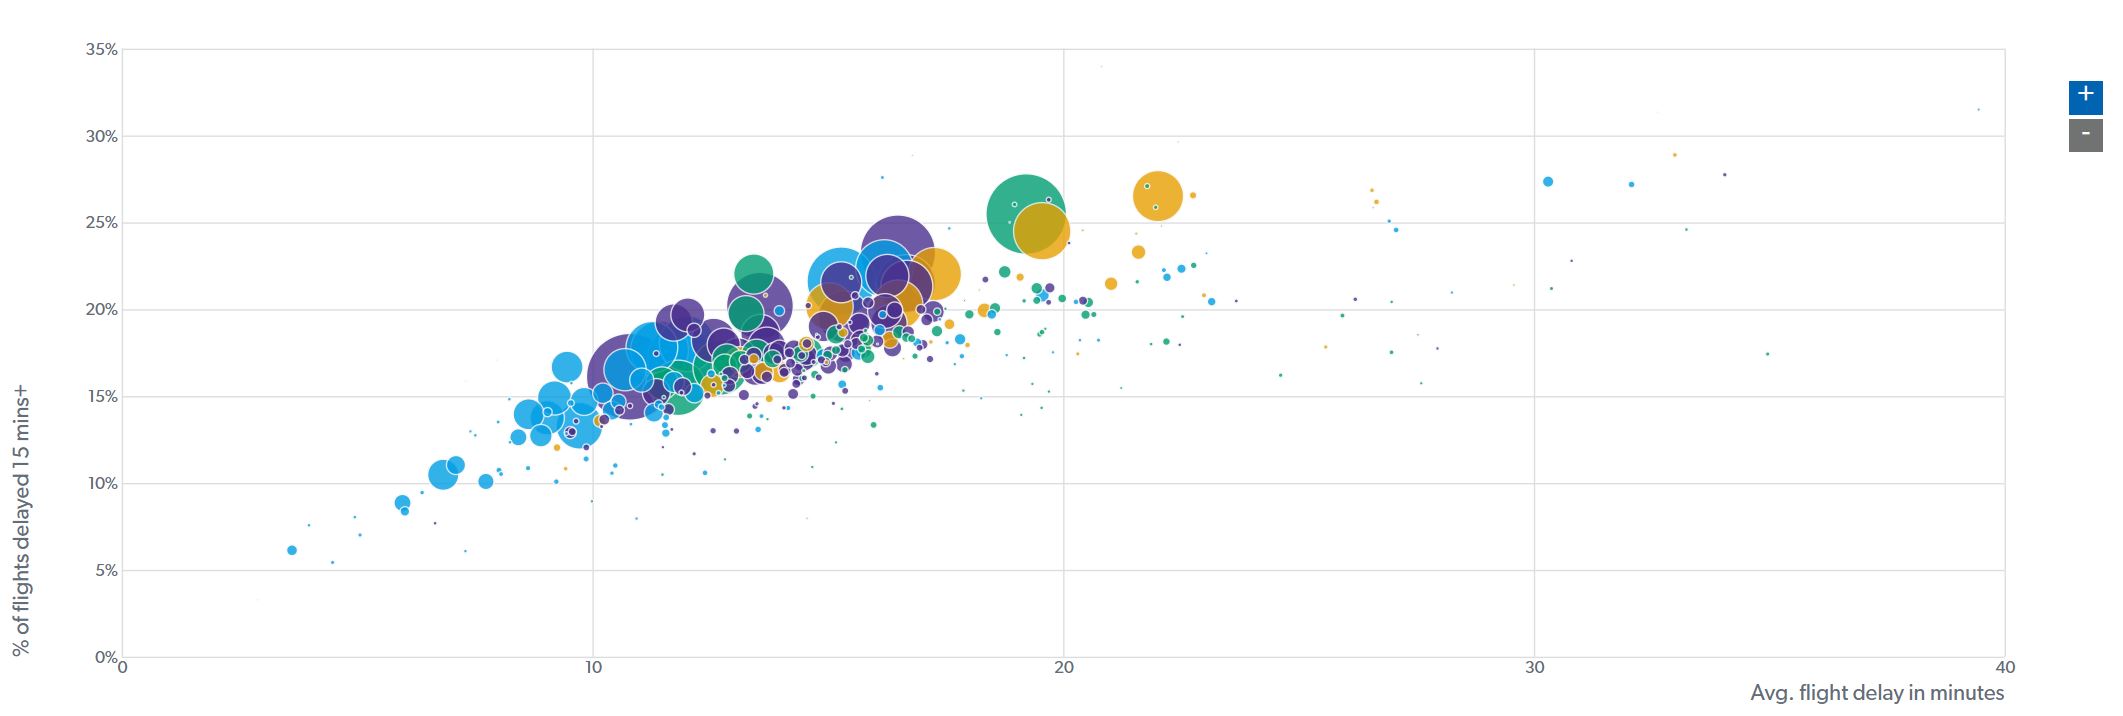
Air travel from March to the end of 2020 was down 72% from the same period in 2019.
Infrastructure
February 2021 car travel was 55% above the low in April 2020, but was still 11% below February 2020.
Infrastructure
The proportion of bridges rated as poor decreased from 9.4% in 2012 to 7.5% in 2019.
Infrastructure
However, 45% of minor urban roads and 26% of mid-size urban roads remain in unsatisfactory condition.
Infrastructure
Two-thirds of train tunnels and nearly one-third of train control systems and elevated structures were rated as poor or substandard as of last count.
Explore the Transportation & Infrastructure Big Picture