Economy
Poverty grew in 2020 as Americans lost income and health insurance.
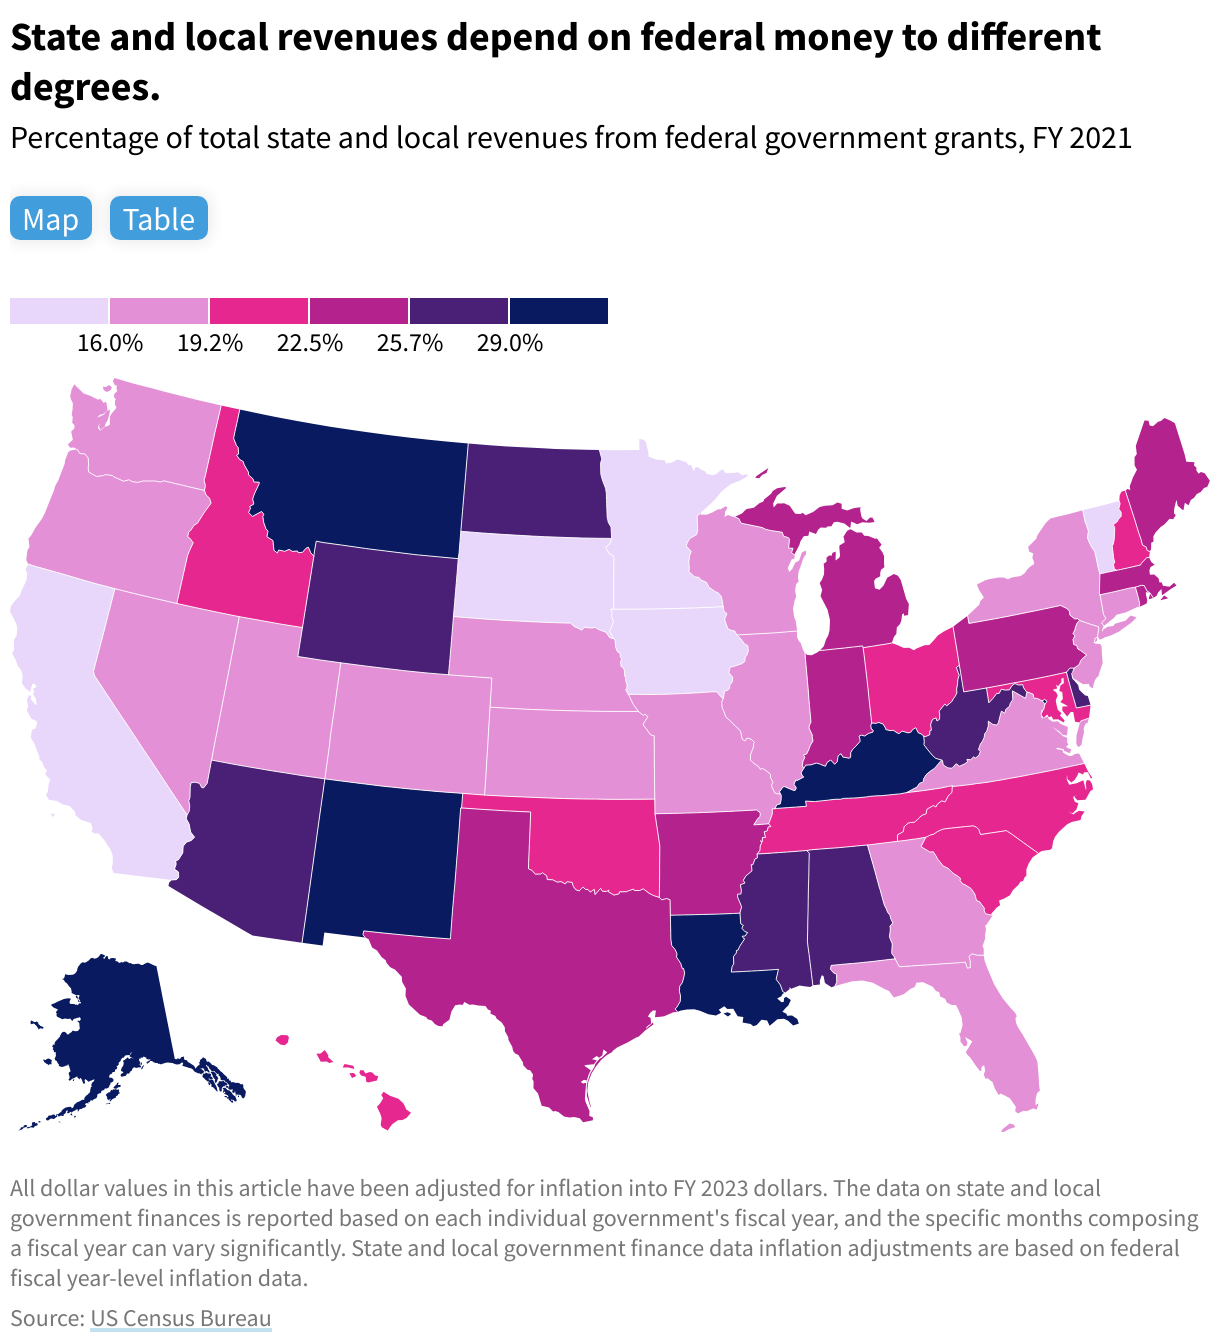
In 2021, the US government provided nearly $1.3 trillion[1] to state and local governments through federal grants. These grants made up a fifth of states’ total revenues, funding healthcare, education, social services, infrastructure, and public safety programs.
Overall, federal aid to state and local governments has risen by over $400 billion since 2019 because of COVID-19's burden on healthcare and social programs.
Though Office of Management and Budget data show that while federal grants increased annually from 2013 to 2021, they fell in 2022 (when adjusted for inflation).[2]
Federal funding comes through several overlapping programs targeting state and local governments. The proportion of state revenues attributable to federal aid is determined by combining the funding received by both state and local institutions.
The five states that received the most federal aid were:
These figures largely correlate with population. To interpret state reliance on the federal government more accurately, we can look at total aid as a percentage of annual state revenues.
In 2021, Montana led the states with the highest proportion of federal funding to the overall budget at 31.8%, followed by New Mexico (30.7%), Kentucky (30.1%), Louisiana (29.8%), and Alaska (29.0%).
Vermont relied on federal grants the least, with just 12.8% of its total budget coming from the federal government – a total reversal from 2020, when it topped the list with 35.7% of revenues coming from the feds thanks to four federal acts passed that year. In 2020 and 2021, Vermont received over $4.9 billion in federal grants.
Despite receiving the most federal funding dollar-wise, California was the second-least reliant state on a percentage basis, with 14.5% of revenue coming from the federal government, followed by Minnesota (14.6%), South Dakota (15.0%), and Iowa (15.5%).
Another way to evaluate reliance on federal funding is on a per-person basis, where federal funding is represented as the average amount a state receives per resident to better illustrate the extent of federal support relative to population.
Using this metric, Alaska had the highest rate of federal funding in 2021 at roughly $8,628 per person, a whole 26.5% more than the second-highest state, Rhode Island, which received $6,821. They’re followed by New Mexico ($6,748), Wyoming ($6,718), and Delaware ($6,011).
You are signed up for the facts!
Florida received the least federal funding per person, $2,693. At the lower end of the spectrum were Kansas ($2,750), Nevada ($2,792), Wisconsin ($2,889), and South Dakota ($2,919).

While a per-capita analysis offers insights into the average federal investment per resident, it may overlook nuances that influence federal aid allocation, such as the prevalence of low-income families, the incidence of natural disasters, economic fluctuations, and recent Medicaid expansions. These shifting circumstances can cause federal assistance to vary year over year.
States with unique needs or higher costs may have disproportionately higher per-person federal funding — New Mexico, whose Medicaid enrollment rate of 38.3% is higher than the 23.6% national average, ranks in the top three for federal per-capita funding due in part to its increased federal Medicaid support.
Federal assistance is typically allocated through grants to support a broad range of basic services, including health care, education, social services, infrastructure, and public safety.
The COVID-19 public health emergency – which officially ended May 11, 2023 – made it difficult for local organizations to request funds and for federal bodies to grant them due to stringent requirements attached to specific grant measures, as opposed to general purpose fiscal assistance. As a result, the Office of Management and Budget issued temporary exceptions to allow aid to flow more freely during the pandemic.
Total 2021 federal aid grants grew to over $1.4 trillion – about 5.4% of US GDP that year and just over 18% of all federal spending, according to federal data.[3]

Total federal funding to state and local governments fell 23.2% between 2021 and 2023 but remains higher than pre-pandemic levels. Much of this reduction is attributable to the December 2021 end of the Covid Relief Fund, which provided general support to help states maintain balanced operating budgets amidst the pandemic's economic downturn.
The Census Bureau provides annual state and local government finance statistics and historical datasets on the revenue, expenditure, debt, and assets (cash and security holdings) for US governments. Data is available up to 2021 as of February 28, 2024.
Additional statistics on federal grant money by category are compiled by the USAFacts team for our State of the Union in Numbers report.
Get more economic updates and data on federal spending from USAFacts, and get the latest data by signing up for our newsletter.
Federal data about transfers to state and local governments does not exactly match the data from state and local governments. This discrepancy is likely due to two primary reasons: 1) The data from state and local governments are estimates based on survey data, whereas the federal data is a financial accounting from administrative data of how federal money is spent; 2) The federal data is reported on a federal fiscal year basis, while the state and local data is reported according to the fiscal year used by each state. Most state fiscal years do not match the federal fiscal year. The figure listed here compiles state and local data on federal grants, while the $1.4 trillion figure listed later on uses data from the federal government.
2022 data for federal transfers to states is available from the federal budget but state budgets for 2022 are not yet available to understand what role those transfers played in state and local budgets.
See the first footnote for an explanation as to why this figure is different than the $1.3 trillion.