What is the US poverty rate?
10.6%
35.9M
In 2024, 10.6% of the US population were living under the poverty line.
Poverty rate, 1959–2024

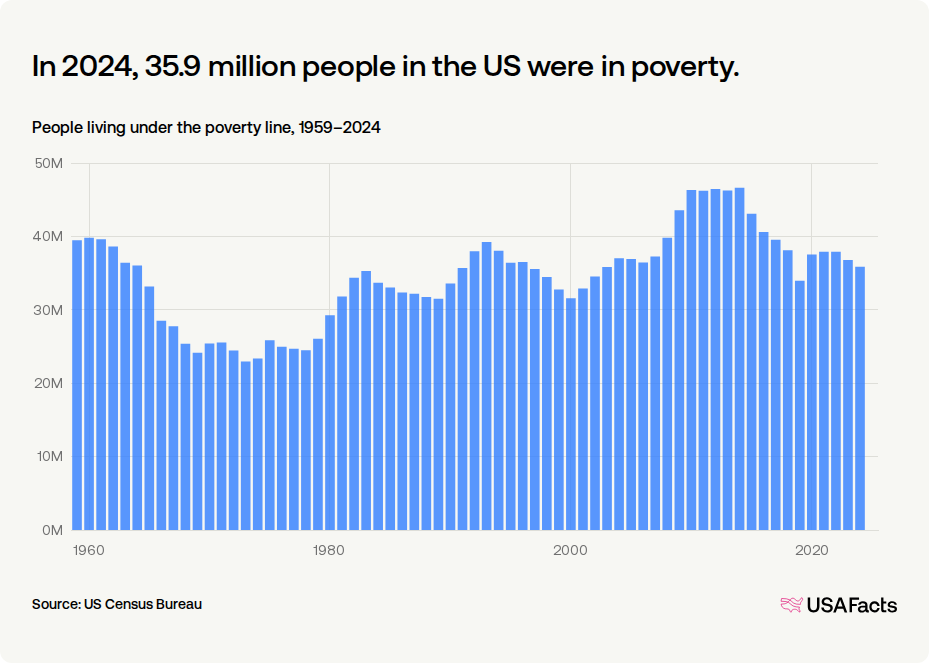
In 2024, 35.9 million people in the US were in poverty.
People living under the poverty line, 1959–2024
What is the child poverty rate?
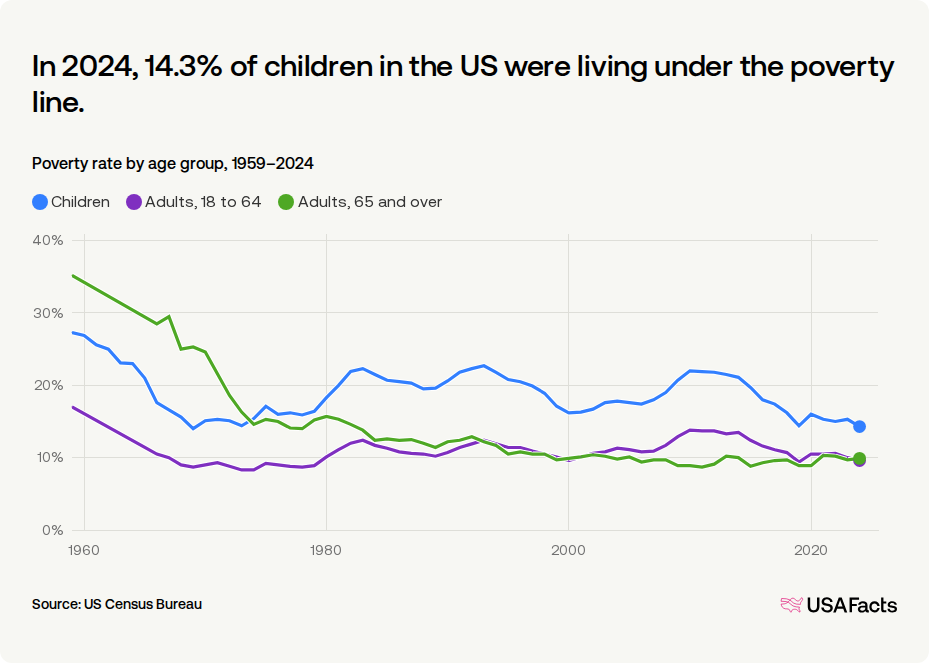
In 2024, 14.3% of children in the US were living under the poverty line.
Poverty rate by age group, 1959–2024
How does poverty differ by family characteristics?
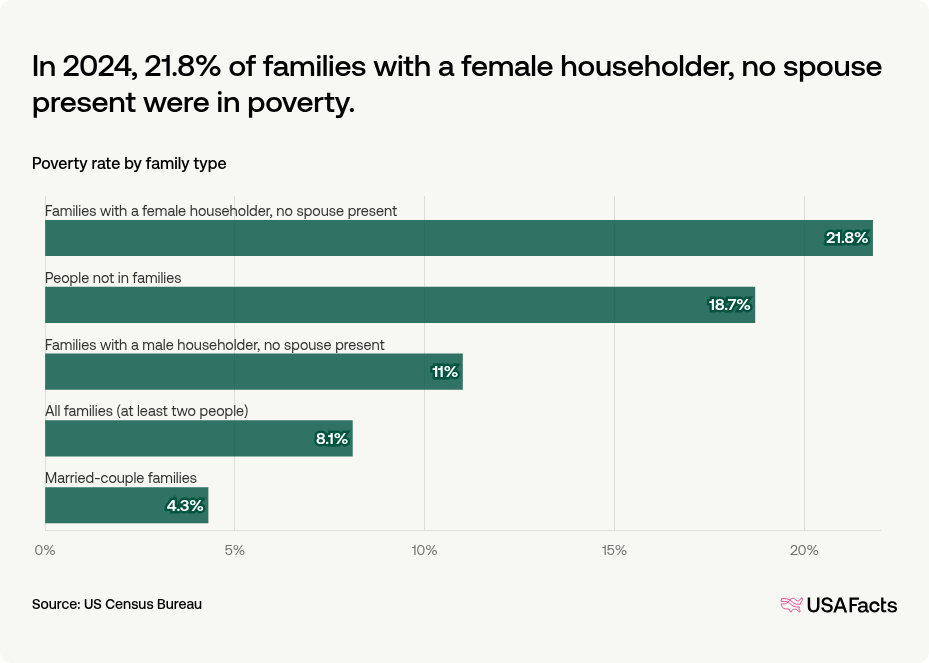
Poverty rates also vary by family type — single-parent families, married couples, and individuals living alone all deal with different economic circumstances. In 2024, 21.8% of families led by a female householder with no spouse present lived in poverty, while only 4.6% of married-couple families did.
In 2024, 21.8% of families with a female householder, no spouse present were in poverty.
Poverty rate by family type
How does poverty differ by race?
In 2024, 19.3% of the American Indian and Alaska Native population was living under the poverty line.
Poverty rate by race and ethnicity, 2002–2024

What states have the highest and lowest poverty rates?
In 2024, Louisiana had the highest poverty rate at 18.7%.
Poverty rate
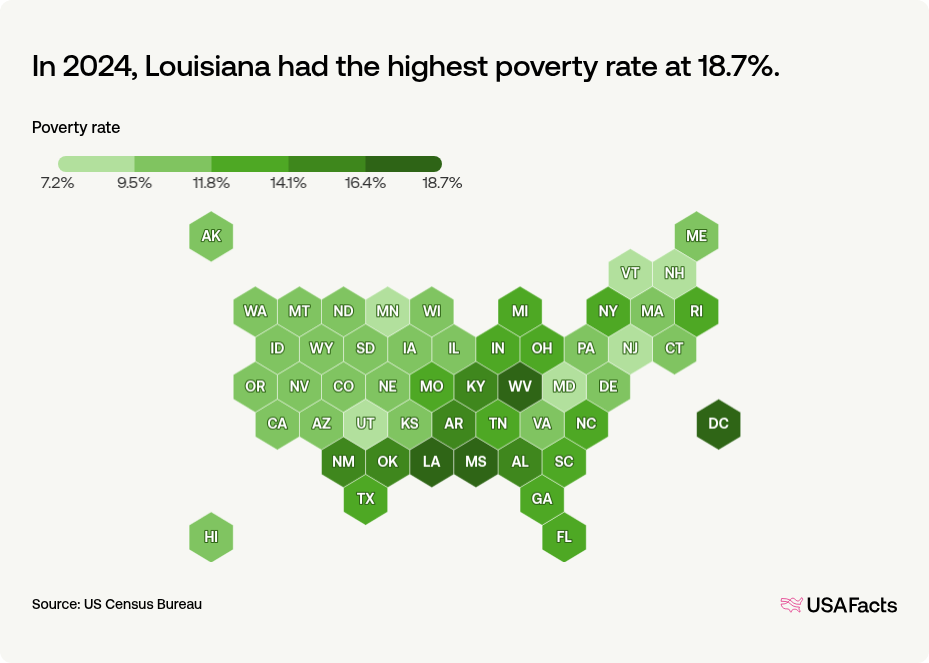
Poverty rate, by state (2024)
| 1. | Louisiana | 18.7% |
| 2. | Mississippi | 17.8% |
| 3. | District of Columbia | 17.3% |
| 4. | West Virginia | 16.7% |
| 5. | New Mexico | 16.4% |
| 6. | Kentucky | 15.6% |
| 7. | Arkansas | 15.5% |
| 8. | Alabama | 15.2% |
| 9. | Oklahoma | 14.9% |
| 10. | New York | 14% |
What Does the Government Define as Poverty?
Keep exploring
Methodology
USAFacts standardizes data, in areas such as time and demographics, to make it easier to understand and compare.
Page sources
USAFacts endeavors to share the most up-to-date information available. We sourced the data on this page directly from government agencies; however, the intervals at which agencies publish updated data vary.
