Health
What health conditions make people more vulnerable to COVID-19?
September was the third consecutive month in which the US recorded over 1 million known cases of COVID-19, though the number of cases was down 17% from 1.45 million in August to 1.2 million. By the end of September, there were 7.17 million known cases of the virus since the beginning of the year, one for every 46 residents.
The case rate more than doubled in Wisconsin between August and September (from 389 cases per 100,000 residents up to 919 cases per 100,000). North Dakota, South Dakota, Utah, and Wyoming each had more than a 70% increase in case rates. In North Dakota, there were 1,317 cases per 100,000 residents, the highest monthly rate of any state during the pandemic except for Florida in July (1,480 cases per 100,000 residents). The national case rate in September was 365 cases per 100,000 people, down 17.3% from August when there were 442 cases per 100,000 people.
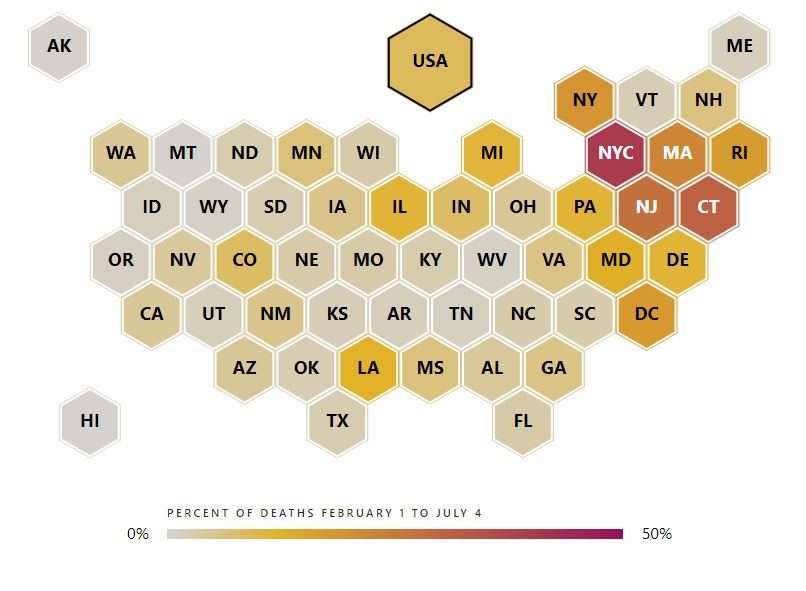
While the number of deaths attributed to COVID-19 passed 200,000 in September, the number of monthly deaths dropped 23% from 30,103 in August to 23,110 in September. Notably, deaths dropped in Texas 47% from 5,964 in August to 3,172 in September. All states that had over 1,000 deaths in August had a decline in September:
Four states had triple-digit increases in deaths: Arkansas, Missouri, Virginia, and Kansas
In May, the median age of someone who tested positive for COVID-19 was 46 years old, according to the Centers for Disease Control and Prevention (CDC). In August, the median age for someone with a positive test was 38.
The CDC recently released multiple reports looking at COVID-19 cases among younger Americans. The agency found that between August 2 and September 5, the number of COVID-19 cases rose 55.1% among 18- to 22-year-olds.
The increase was notable among young white people, as the case rate during the month examined increased from 48 cases per 100,000 people to 120 cases per 100,000 people. According to the CDC report, "because approximately 45% of persons aged 18–22 years attend colleges and universities and 55% of those attending identified as White persons, it is likely that some of this increase is linked to resumption of in-person attendance at some colleges and universities."
The agency also looked at cases among school-aged children and found that the case rate peaked in July for 5 to 17-year-olds at 37.9 cases per 100,000 people. As the summer ended, the case rate decreased to 22.6 cases per 100,000 people the week of Sept. 6. With the school year resuming and some students returning to in-person instruction, the case rate has since increased to 26.3 cases per 100,000 people.
The unemployment rate has dropped in every month since hitting a high of 14.7% in April, according to the Bureau of Labor Statistics. In September, the rate was 7.9%. While the falling economic indicator is a good sign for the economy, it only considers those people in the labor force who have jobs or are seeking jobs.
In April, the labor force participation rate, the percentage of people 16 or older looking for jobs or already employed, was 60.2%, the lowest level since 1971. It since increased to 61.7% in August and dropped to 61.4% in September. Whether this decrease is a one-time occurrence or a signal that the pandemic's economic recovery will not be swift remains to be seen, but the labor force statistics are well below where they were in February before the effects of the pandemic. Between February and September, the number of working-age people not in the labor force increased by 5.5 million. Additionally, the number of people in the labor force decreased by 4.4 million.
The economic situation is affecting the job status of women more than men. Women account for 2.6 million, or 60% of the drop in the number of people in the labor force. Women also account for 3.1 million or 58% of the group not in the labor force.
At the end of July, an expansion of unemployment insurance giving an additional $600 per week to nearly anyone who lost work expired.
Personal income decreased 2.7% in August, reflecting the end of the federal pandemic unemployment assistance, which provided those on unemployment an additional $600 every week, according to the latest data from the Bureau of Economic Analysis.
Total unemployment insurance income decreased by 52% from $110 billion in July to $52.8 billion in August. Despite the drop in unemployment benefits, overall personal income is still higher than in January, due to additional government transfers due to the pandemic.
One significant impact the pandemic was an increase in the savings rate. The savings rate has receded from a high in April and dropped from 17.7% in July to 14.1% in August. That is still more than double January's savings rate of 7.6%.
The United States has 53 metropolitan areas home to at least 1 million people. These areas are home to 183 million people (55.7% of the population).
As of August, these areas had a combined 84.8 million jobs, 7.5% lower than the 91.7 million employed in February.
But big cities in the South and Midwest were just 5.3% and 5.8% off, respectively, from February employment. Employment in Austin, Texas was just 1.8% lower in August than in February, the best of any metropolitan area. Other cities within 3% of previous employment levels were Indianapolis, Dallas, San Antonio, Texas, and Birmingham, Alabama.
Meanwhile, in the West, the number of jobs was 9.6% lower. Both Los Angeles and Las Vegas had 16% fewer jobs in August than February.
In a region that was hit early by the pandemic, Northeastern employment levels are 10% lower than in February. Boston had 13.9% lower employment in August compared with February while New York City's employment was down 10.3%.
See more data about COVID-19 cases and deaths or follow the economic situation on the Impact and Recovery Hub.
Health
Health
Health
Health
Newsletter
Keep up with the latest data and most popular content.