Health
What health conditions make people more vulnerable to COVID-19?
In the second year of the COVID-19 pandemic, a lot changed in how the US responded to the virus. By early March, three different vaccines received emergency use authorization from the federal government. A vaccine requirement was also put in place for federal workers and later extended to all private employers larger than 100 employees.
At the same time, governments reduced restrictions on where people could go or what they could do. Many states stopped requiring masks indoors. Large events like concerts and live sports resumed.
The US recorded 31.8 million new COVID-19 cases in 2021, up 59% from just under 20 million in 2020.[1] Two states had a lower-case count in 2021 than in 2020: North Dakota and South Dakota. Hawaii had the lowest case rate, with 6% of its population testing positive, while West Virginia had the highest at 14%.
As of December 27, the CDC has age data on 22.9 million cases in 2021. Based on that data, 9% of people aged 20 to 29 tested positive in 2021, the highest of any age group based on 10-year increments. While the 0 to 9 and 10 to 19 age groups had the lowest case rates in 2020, the two groups also had the biggest increases in cases in 2021. COVID vaccines weren’t eligible for kids 12 and older until May while children 5 to 11 became eligible in November.
In 2021, 5% of 0- to 9-year-old children test positive compared with 2% the previous year. For 10- to 19-year-olds, the case rate increased from 4% in 2020 to nearly 8% in 2021. Both groups had an increase in cases beginning August as the new school year began in many states.
Non-Hispanic white people accounted for 65% of COVID-19 deaths this year while making up just shy of 60% of the US population. That gap is the biggest among seven racial and ethnic groups for which the CDC has data available. The other groups with more COVID-19 deaths relative to their population were three non-Hispanic groups: Black, American Indian or Alaska Native, and Native Hawaiian or Pacific Islander.
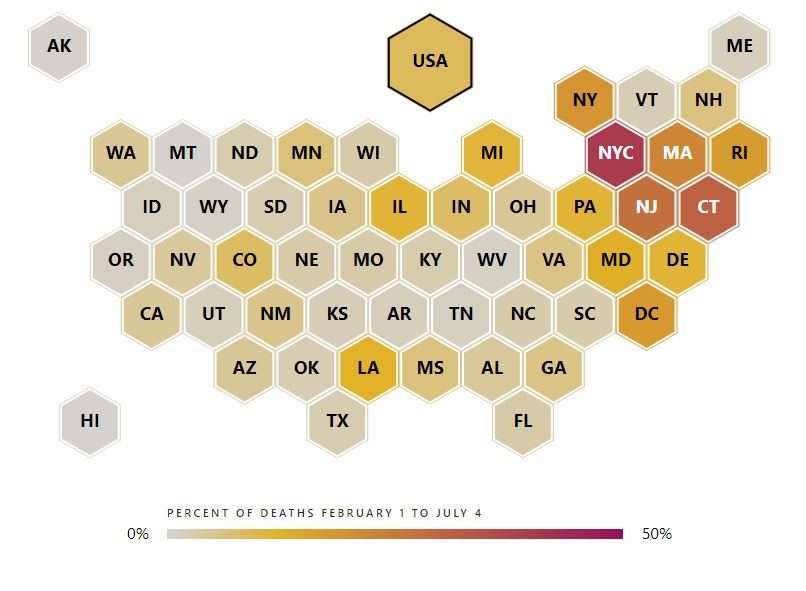
As of December 29, 456,789 deaths in 2021 were attributed to COVID-19, up 29% from 355,294 deaths in 2020.
The rise in deaths was not uniform across the country. While the number of deaths in 2021 more than doubled in 15 states over the previous year, deaths decreased in 12 states and Washington, DC. States hit hard in 2020 — Connecticut, New Jersey, New York, North Dakota, and Massachusetts — all had more than 40% fewer COVID-19 deaths in 2021.
Seventy percent of adults got at least one shot by August 16, more than a month after President Biden's original target of July 4. As of December 21, 73% of all Americans have gotten at least one jab.
The number of vaccine doses peaked at an average of 3.3 million a day in mid-April when all adults became eligible for vaccination. Excluding holidays when regular data reports are unavailable, vaccinations hit a low in September, with 625,000 getting a shot every day. Since then, with the advent of the Omicron variant and expansion of booster shot eligibility, daily doses exceeded 2 million in early December.
Learn more from USAFacts and get the data directly in your inbox by signing up for our newsletter.
This is a comparison of cumulative annual data. Note that while the pandemic was officially declared in March 2020, widespread testing wasn’t available early in the year.
Health
Health
Health
Health
Newsletter
Keep up with the latest data and most popular content.