Every four years, a pattern repeats: fewer Americans vote in the midterm election than did in the presidential race before it. That voter drop-off has persisted for decades, but in the last two election cycles midterm turnout was higher than it was for much of the past four decades.
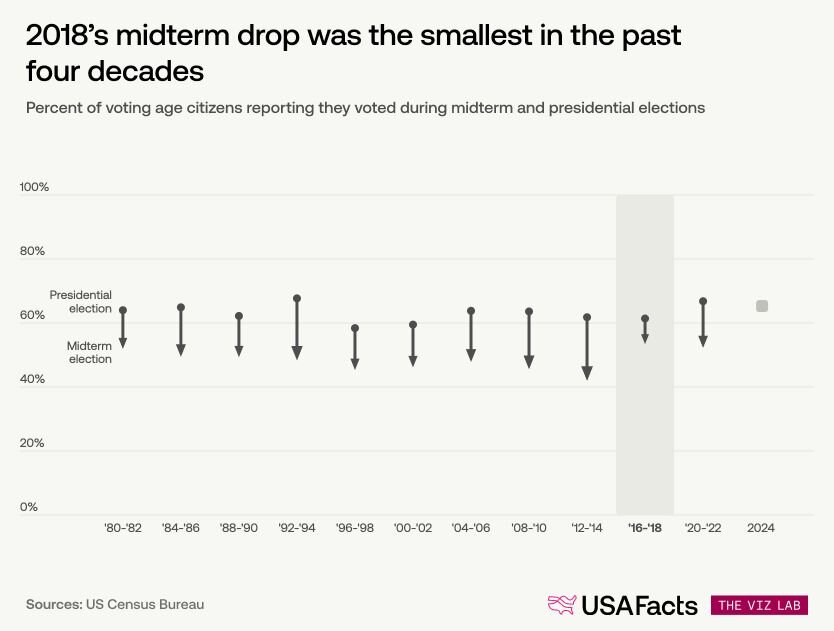
Since 1980, presidential elections have had an average reported voter turnout of 63%. Midterms averaged 48%. Generally, voter turnout drops by an average of about 15 percentage points between a presidential election and the following midterm.
But the 2018 midterms were an exception: turnout fell eight points, the smallest drop in four decades. The 2022 midterms had the standard 15-point dip.
Presidential vote turnout was atypically high in 2020. And despite the standard midterm dip, 2022’s turnout was still 52%, the second-highest midterm turnout in the available data. (2018 was the highest)
The 2026 midterms are fast approaching. Before Americans head to the polls (or their mailbox) this fall, let’s look at census data from the last full election cycle to understand this uptick in midterm voting.
Get weekly insights
Subscribe for data-driven insights. No spin, just the facts.
Who is most likely to vote in midterm elections?
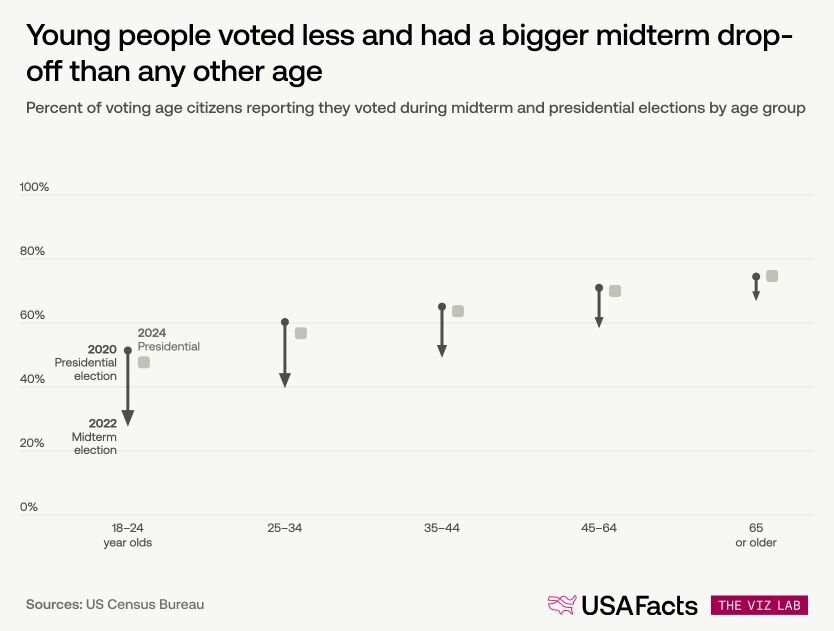
In the most recent full election cycle, young people not only had the lowest presidential vote turnout, but they were also the least likely to vote in the midterms. Less than 30% of 18 to 24 year olds voted in the 2022 election. Conversely, people 65 or older had the highest turnout and smallest drop-off.
Voter turnout by income
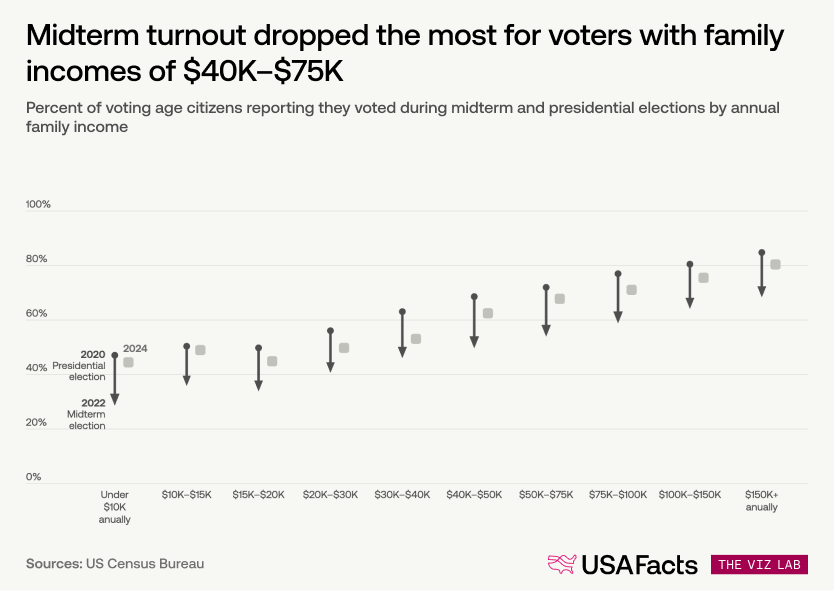
The likelihood of voting rose with a person's family income in both presidential and midterm elections. The drop between the two, however, was largest among people in families earning between $40,000 to $75,000 a year. Nearly 70% of those individuals turned out for the 2020 presidential election but closer to 50% for the 2022 midterms. That’s a drop of 18 to 19 percentage points.
Voter turnout by education
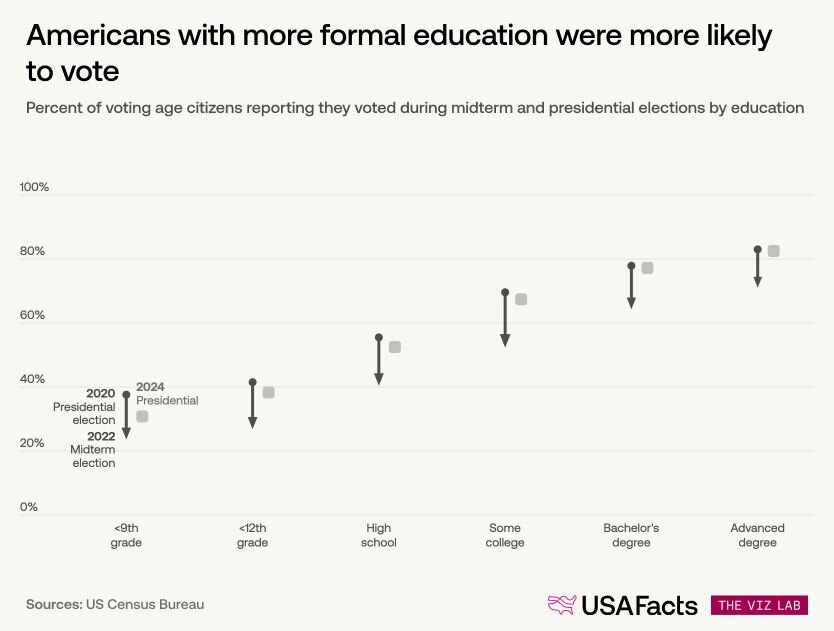
Americans with degrees were more likely to vote in both presidential and midterm elections than those with less formal education. For instance, nearly five out of six people with advanced degrees reported voting in the 2024 presidential election, while one in three without a high school diploma did. Put another way, people with degrees were more than twice as likely to vote as those without a high school education.
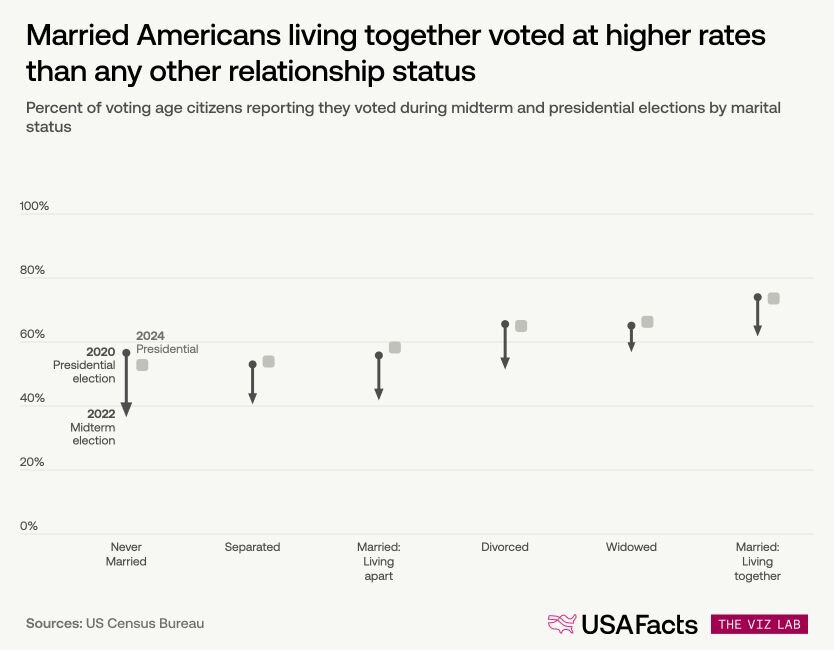
Voter turnout by marital status
Married Americans living with their spouse voted at higher rates in both presidential and midterm elections than any other relationship status; their turnout was nearly 20 percentage points above people who were married but living apart. The drop between the two election types was similar across both groups.
Among other marital statuses, widowed Americans had the smallest turnout drop, eight points, while those who were never married had the largest at 20 points.
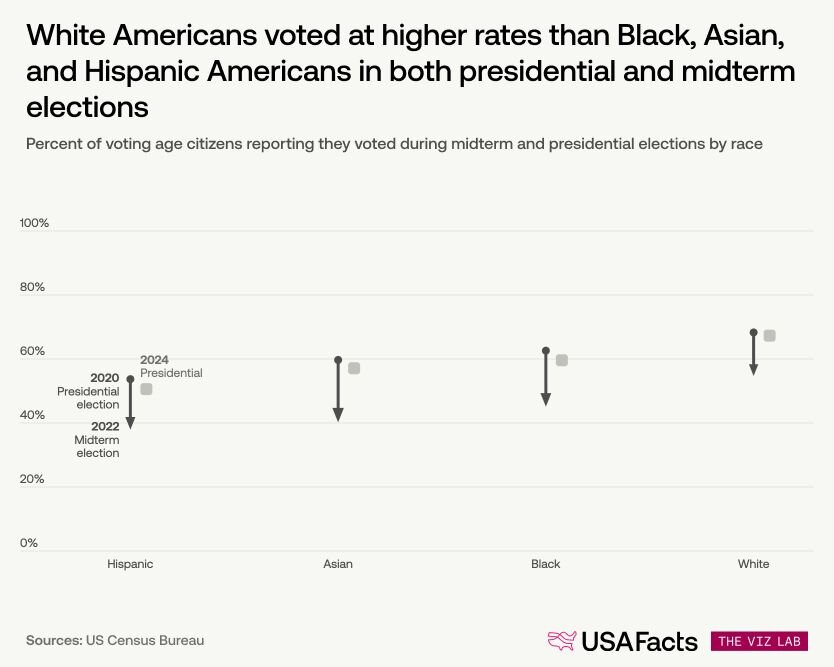
How does voter turnout differ by race, ethnicity, and birthplace?
Fewer than 40% of Hispanic citizens voted in the last midterm election. Asian turnout dropped the most, falling 20 points from the presidential election. White voters had the highest turnout in both elections.
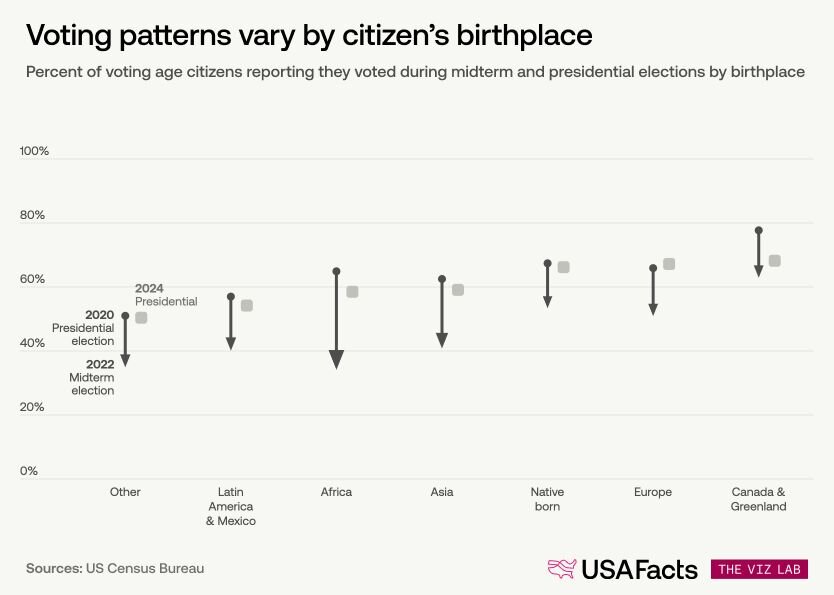
Naturalized US citizens born in Canada or Greenland report voting at higher rates even than native-born Americans. European-born Americans voted at similar levels to native-born, while Latin American- and Mexican-born voted at lower levels.
While African-born citizens voted at similar levels to native-born Americans in the 2020 election, their turnout dropped by 31 percentage points in the 2022 midterm, the largest drop of any of the demographic groups in the data.
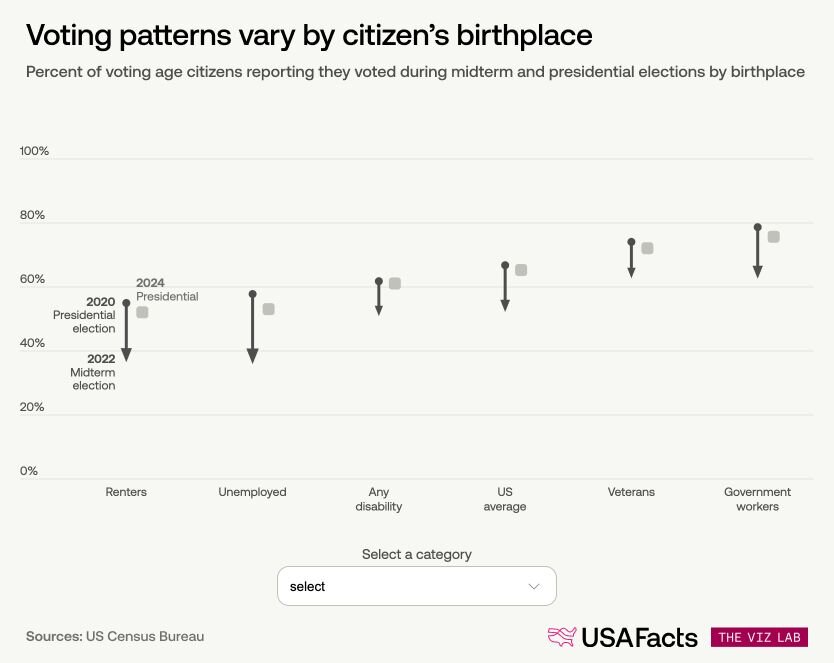
Beyond the demographic categories above, a few other groups stand out. Renters and unemployed people voted below the national average in both elections and had steeper drops in turnout in midterms than most other groups.
Americans with a disability also voted less than average in the presidential election, but their midterm drop-off was among the smallest of any group, 11 points, bringing their midterm turnout close to the national average. Veterans and government workers stood out at the other end. Both voted well above average in both elections with drop-offs at or below the national average.
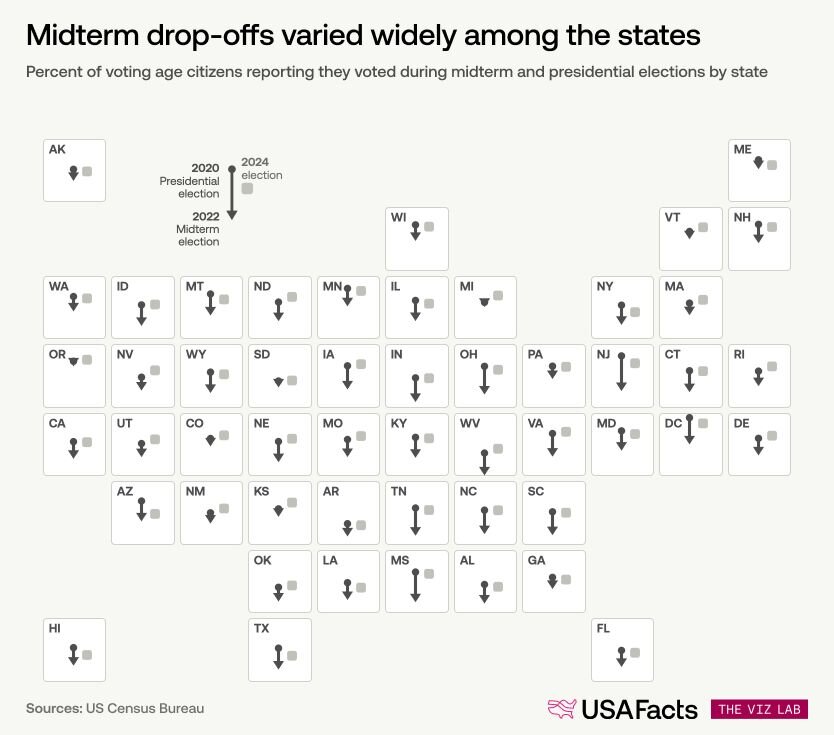
Which states have the highest midterm voter turnout?
Voter turnout was highest in Washington, DC, in both the 2020 and 2024 presidential elections. Among states, Michigan and Oregon had the smallest drop between presidential and midterm turnout, down 4 percentage points. New Jersey had the largest drop, with reported turnout falling 28 percentage points between the presidential and midterm elections.
Notes from The Lab
Notes from The Lab
We are reporting percentage of voting-age citizens (those allowed to vote) rather than percentage of the total population. The Census Bureau source only provides voting-age citizen numbers back to 1980.
Income figures are for households and are limited to those that report income. Households that report not knowing their income were not included. Spouses, children, grandchildren, parents, siblings, or other relatives are considered part of the household; foster children, unmarried partners, non-relatives, and roommates are not.
Keep exploring visualizations
- Is midterm voter turnout really that much lower than presidential years? - Voter drop-off from the previous presidential election was below average in 2018.
- Just the Facts about the US population, demographics, and geography - Household size, racial demographics, the average age of an American: these stats are always changing. And who has a college degree? How many people are registered to vote? Here’s America by the numbers.
- More voters are registering outside the two party system - We mapped voter registration in every state that tracks party affiliation. In three out of four counties, the share of voters registered outside the two major parties grew over the past decade.
- Representation in the Electoral College: How do states compare? - Twenty states are overrepresented in the Electoral College by more than one vote, based on population. Texas is underrepresented by nine votes.
