Home / Population and society / Articles / Weekly US Government Data Roundup: May 9, 2023

Are you saving enough for retirement?

In 2019, about 50% of American households had no savings in retirement account. As employers shift away from the fixed benefits of defined benefit plans and more Americans age into collecting Social Security benefits, individual plans are increasingly crucial for retirement. But how much are people saving? Explore these charts to see how Americans are preparing for retirement based on age and account type.

  • Half of working households ages 50 to 60 had a defined benefit plan in 1989. In 2019, a quarter did.
Bar chart depicting percentage of households that have saved more than $500K for retirement. No age group is above 13%.
  • Seven percent of households had more than $500,000 saved for retirement, while 21% had more than $100,000 saved.
  • Many retired Americans may heavily rely on Social Security benefits; the average annual benefit is about $22,000. Workers currently younger than 63 will be eligible for full Social Security retirement benefits at 67.
Bar chart depicting savings by age in retirement accounts, checking and savings, and other financial assets.
  • For ages 30 to 34, the median household had $1,600 in dedicated retirement accounts, $5,000 in checking and savings, $14,000 in financial assets, and a net worth of $29,000. For ages 55 to 59, the median household had $25,000 in retirement accounts, $5,000 in checking and savings, $40,000 in financial assets, and a net worth of $180,000.

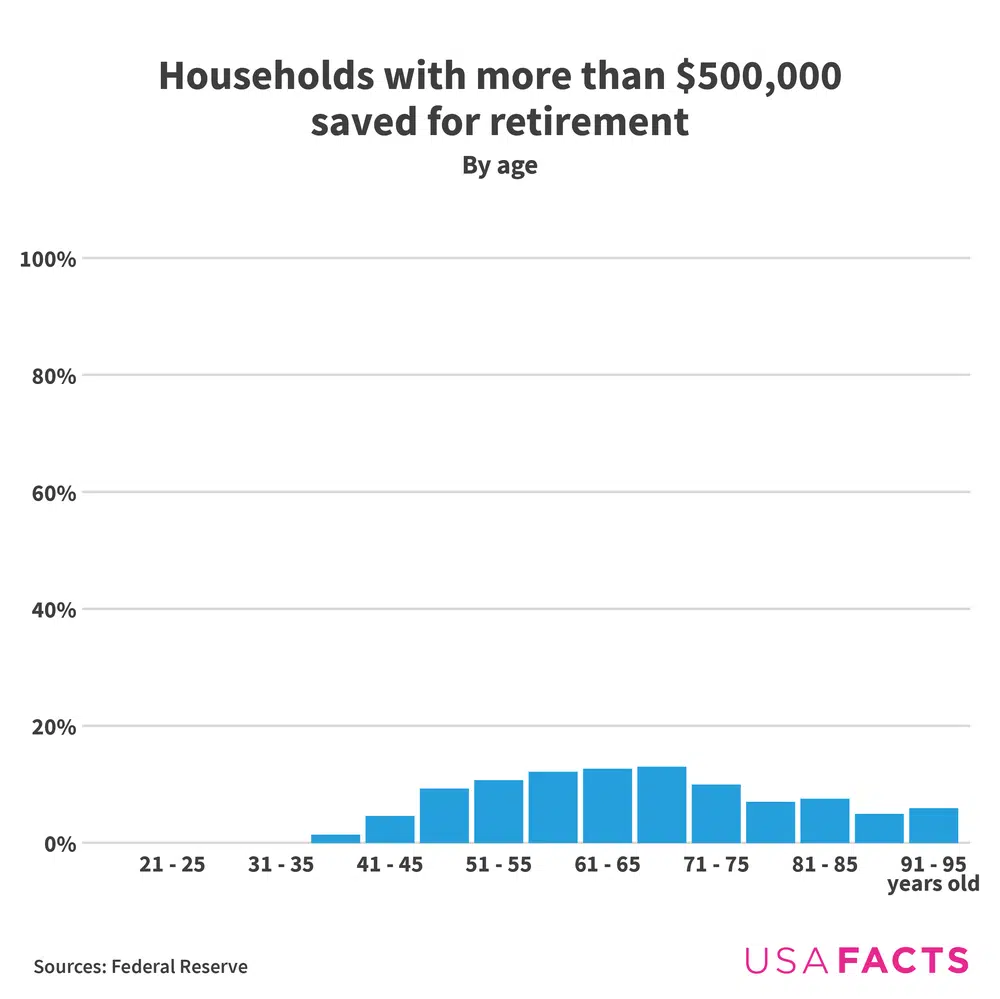
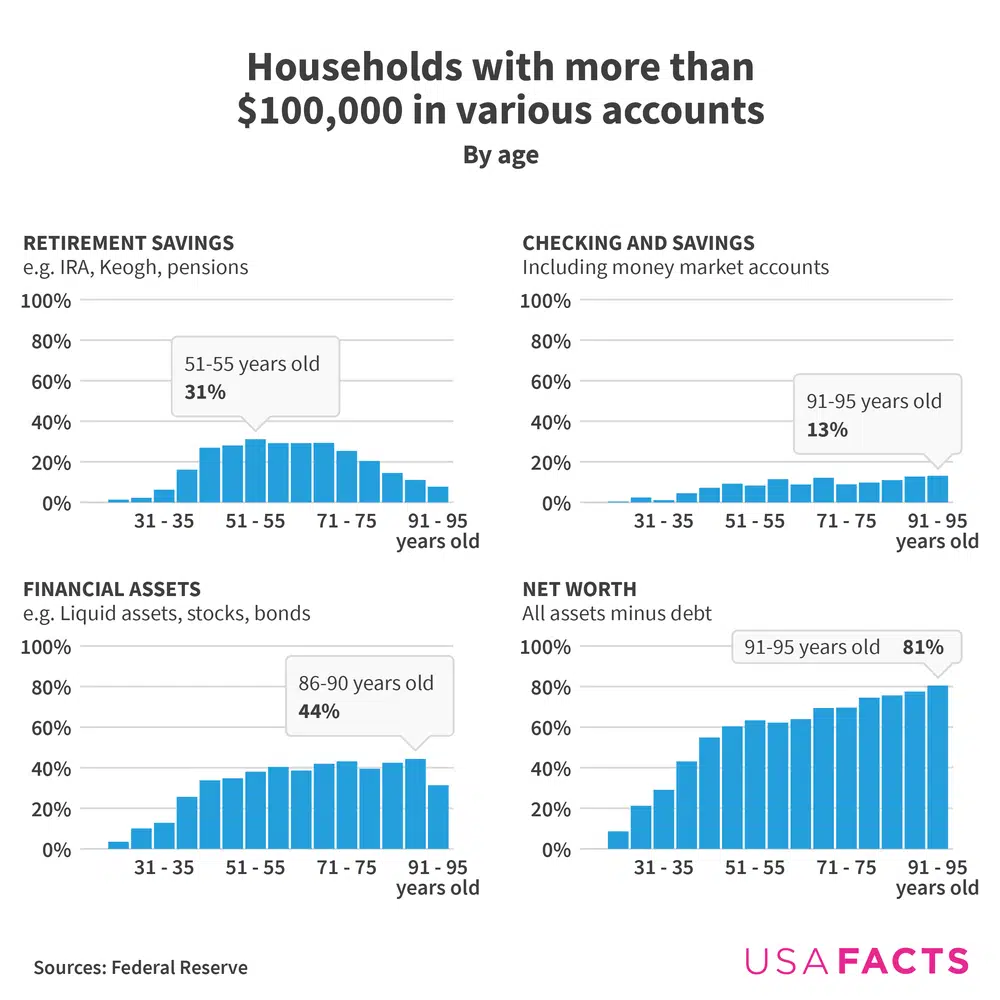
See how your retirement savings compare in this new visual.

Asian American and Pacific Islander Heritage Month

May is an opportunity to recognize the diverse experiences and achievements of the millions of Asian American and Pacific Islander people living in the US. USAFacts has data to help paint a picture of this diverse group, from education levels, home states, family size, and more.

  • Asian Americans and Pacific Islanders are the fastest-growing racial group in the United States, with their population rising 27% from 2011 to 2021 to 23.5 million. They are 7.1% of the US population.
Asian American populations by the numbers. Chinese Americans, Indian Americans, Filipino Americans, Vietnamese Americans, and Korean Americans are the top five.
  • Six Asian American groups have populations exceeding 1 million. Chinese Americans are the largest group (5.3 million people), representing 22% of the Asian American population.
  • Overall, 55% of Asian Americans older than 25 hold bachelor's degrees, compared to 35% of the total US population. However, only 25% of Pacific Islanders over 25 have bachelor's degrees.
Bar chart of median Asian American household incomes. Indian Americans, Taiwanese Americans, Filipino Americans, Pakistani Americans, and Sri Lankan Americans top the list.
  • Indian and Taiwanese American households have the highest education levels and incomes among Asian Americans ($138,418 and $117,652, respectively), while Southeast Asian American households have lower incomes and educational attainment.
  • Asian Americans average 3.4 people per family, slightly larger than the overall US average of 3.2. At 4.65, Hmong American families have the largest average size, while Korean and Japanese American families had some of the lowest averages: 3.05 people.
  • The Pacific Islander homelessness rate is seven times higher than the US average. The group's poverty rate is also higher than the nation overall: 17.6% compared to 12.8%.

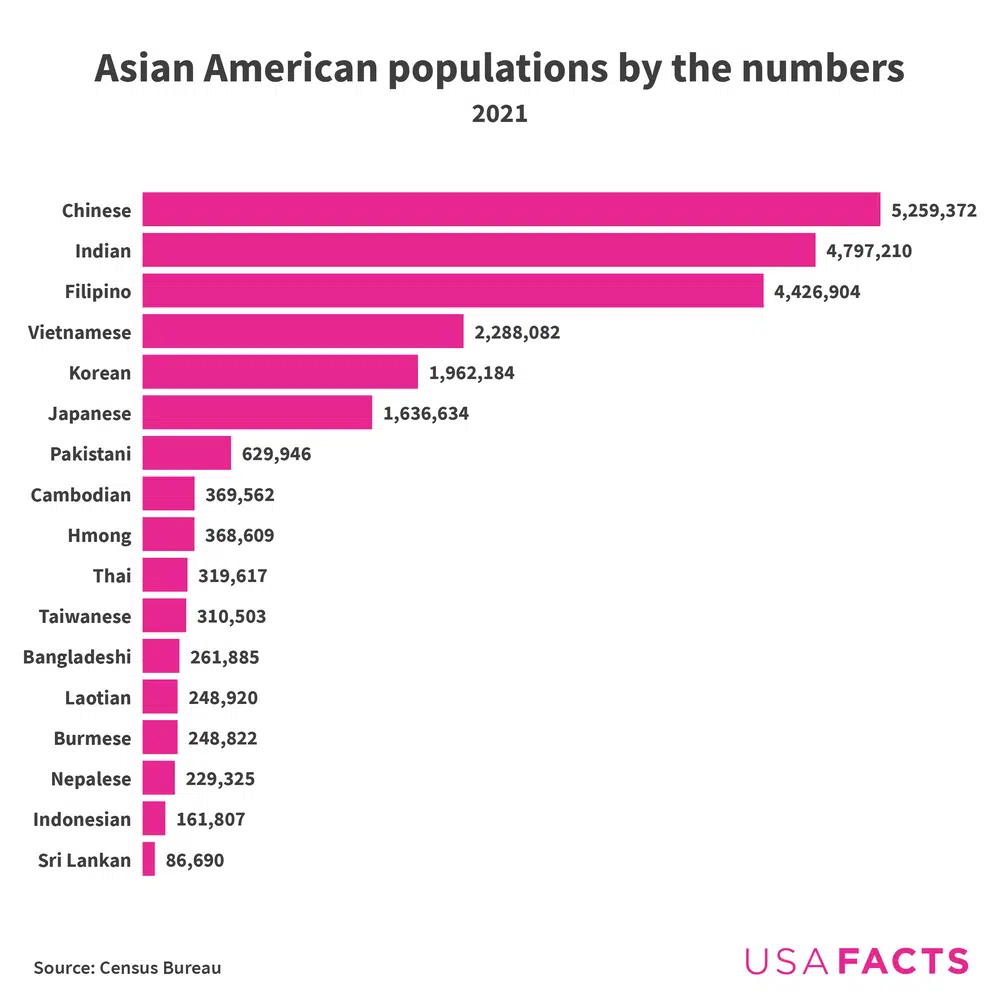
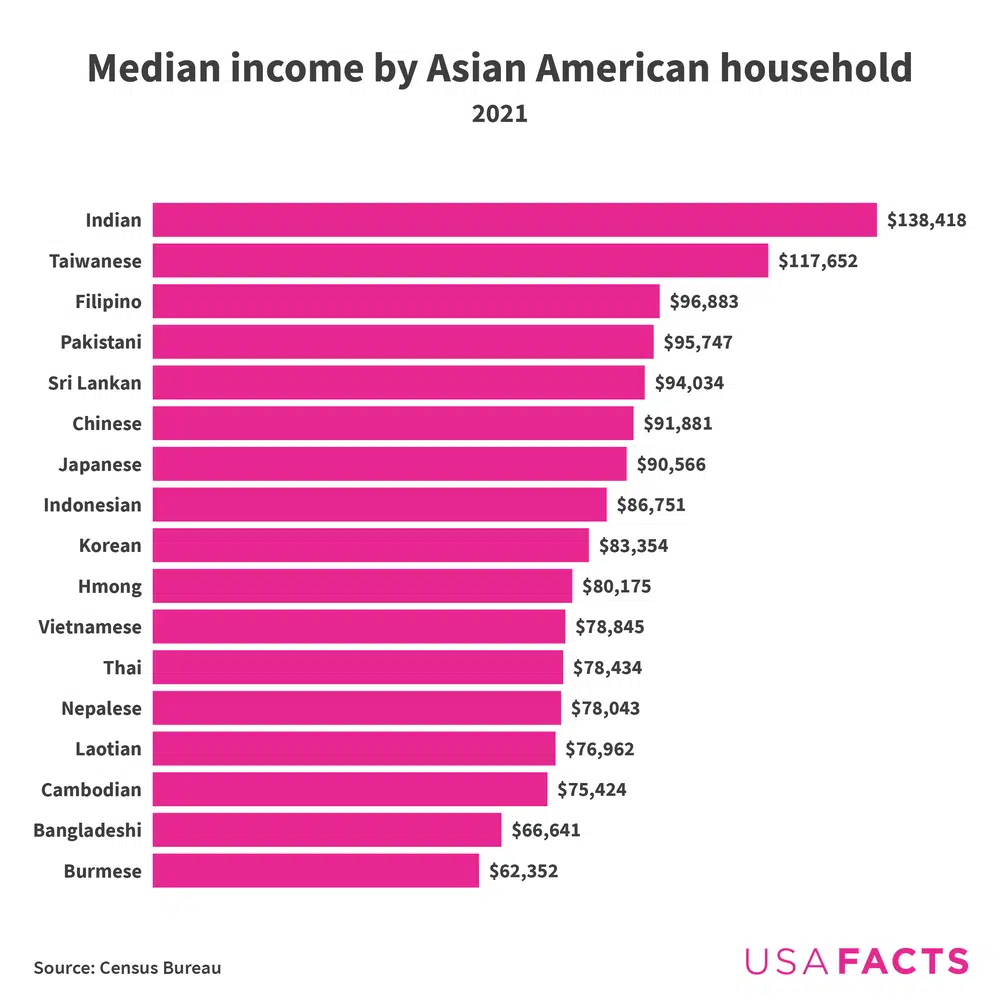
Learn more about people who identify as Asian American or Pacific Islander at USAFacts.

Data behind the news

Today marks the start of Teacher Appreciation Week. This article from our archives covers the demographics of the nation’s teachers. USAFacts also has the numbers on which states pay teachers the highest and lowest wages.

Last Saturday was National Nurses Day. As of May 2022, almost 4 million nurses were working in the US healthcare system.

The Federal Reserve raised interest rates on Wednesday in another attempt to slow inflation.

Dive into the weekly fact quiz to prove your expertise on the newest USAFacts articles.

One last fact

Chart of commercial bee populations dropping by 30% from 1989 to 2008 to 2.6 million

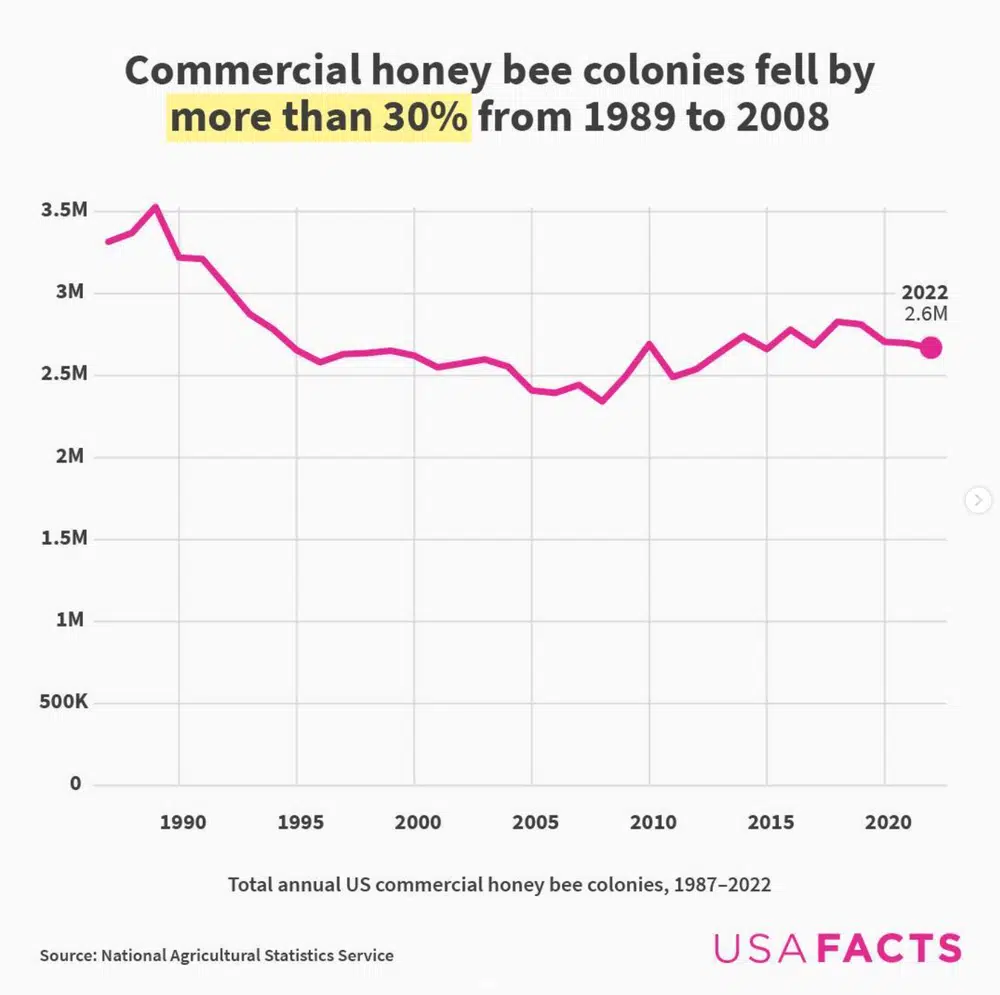
Honey bees pollinate $15 billion in US agricultural products each year, including more than 130 types of fruits, nuts, and vegetables. But bee populations have declined over the decades due to several factors. Between January 2015 and June 2022, the US had a net loss of 300,000 commercial bee colonies.