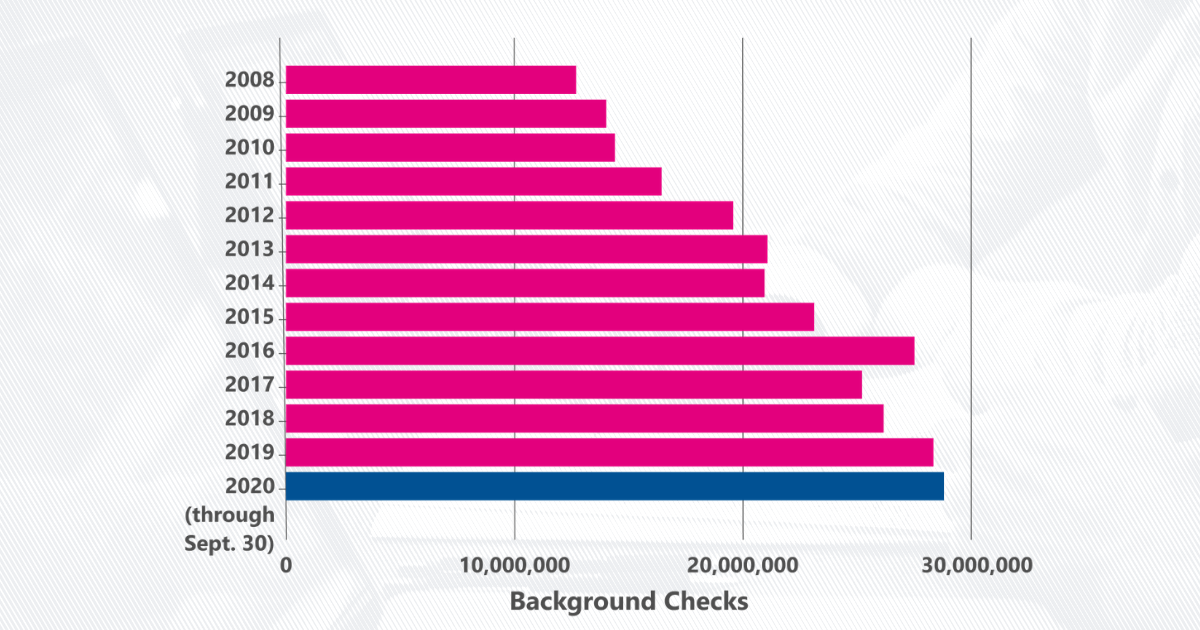
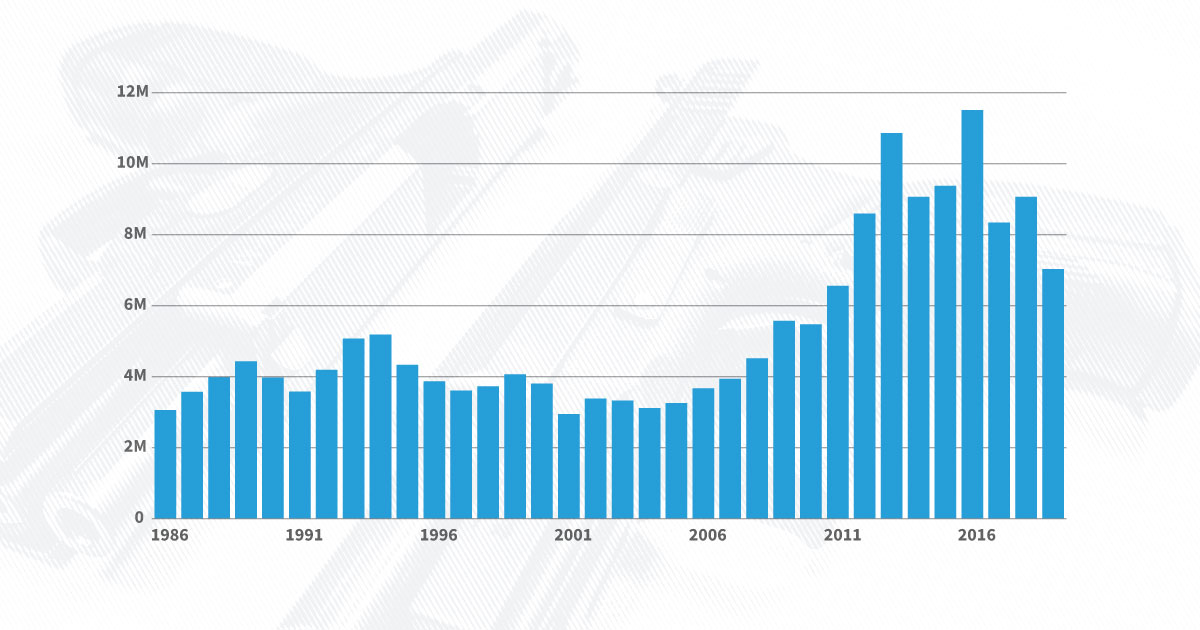
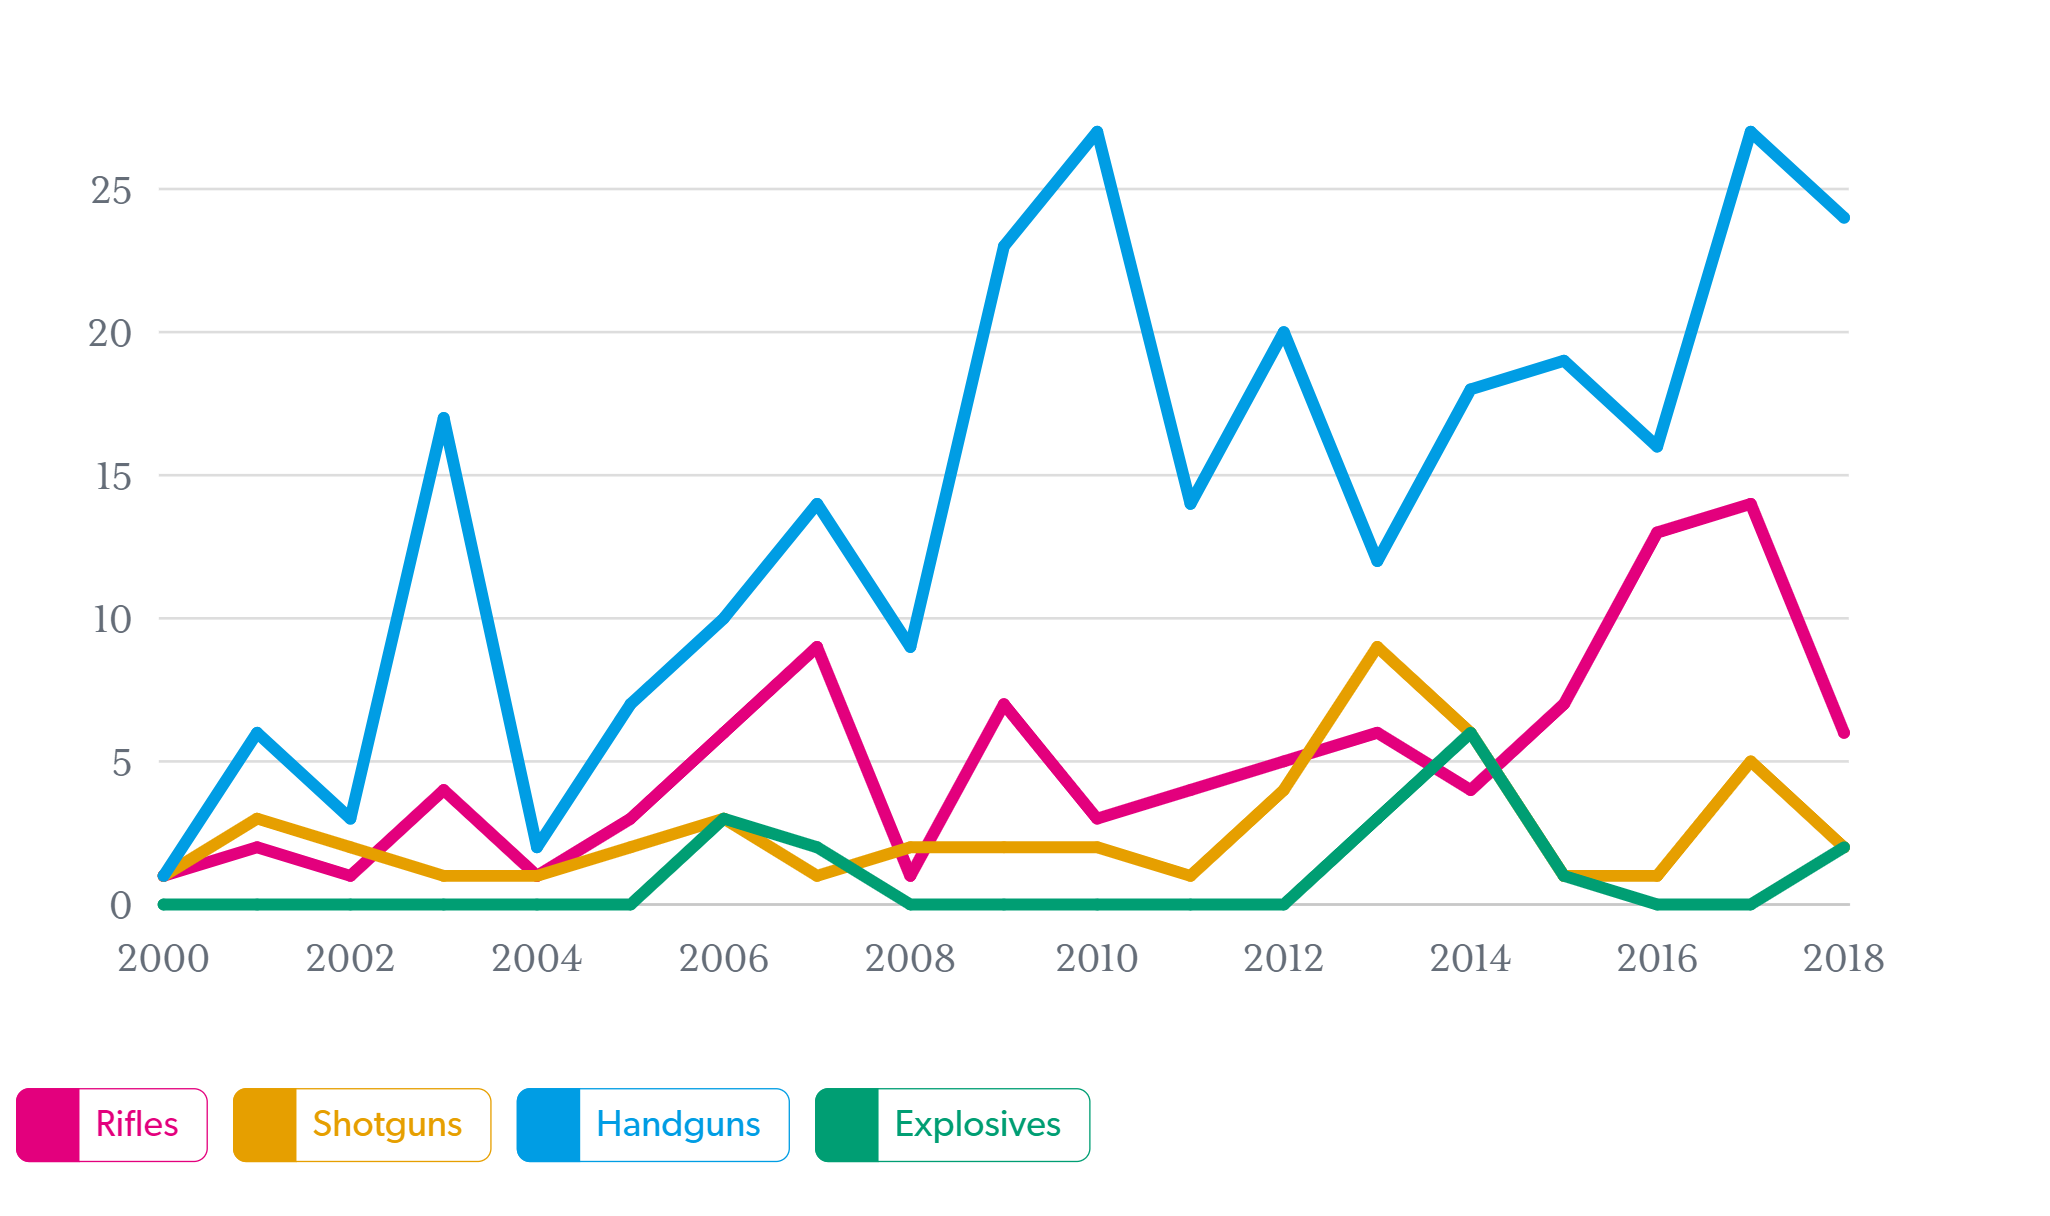
Home / Crime / Articles / Weekly US Government Data Roundup: May 1, 2023

How does the GAO form its high risk list?  

The Government Accountability Office (GAO) is an independent agency that provides unbiased information to help run the government more efficiently and save taxpayers money. The GAO has produced a high risk list since 1990 to identify federal programs vulnerable to waste, fraud, abuse, and mismanagement. As of March, 38 programs were on the list.

Bar chart showing the number of federal programs on the GAO's high risk list. There were just under 15 in 1990. Now there are 38.
  • The GAO evaluates various factors to classify a program as high risk, such as risk to public health or safety, national security, and economic growth. The program must be in danger of losing at least $1 billion. 
  • The high risk list comprises programs rather than the departments that run those programs. For example, the unemployment insurance system lost over $60 billion in fraudulent payments during the pandemic, leading to its inclusion (rather than the Labor Department's) in 2022. 
  • The Defense Department's contract management program has been on the list since 1992. It spent more than $400 billion on contracts in 2020, accounting for over 60% of the department's budget.
  • Several programs on the high risk list — including IRS enforcement of tax laws, protecting the nation's cybersecurity, and administering Medicare — have been wasting government resources for decades without congressional action or other corrections.

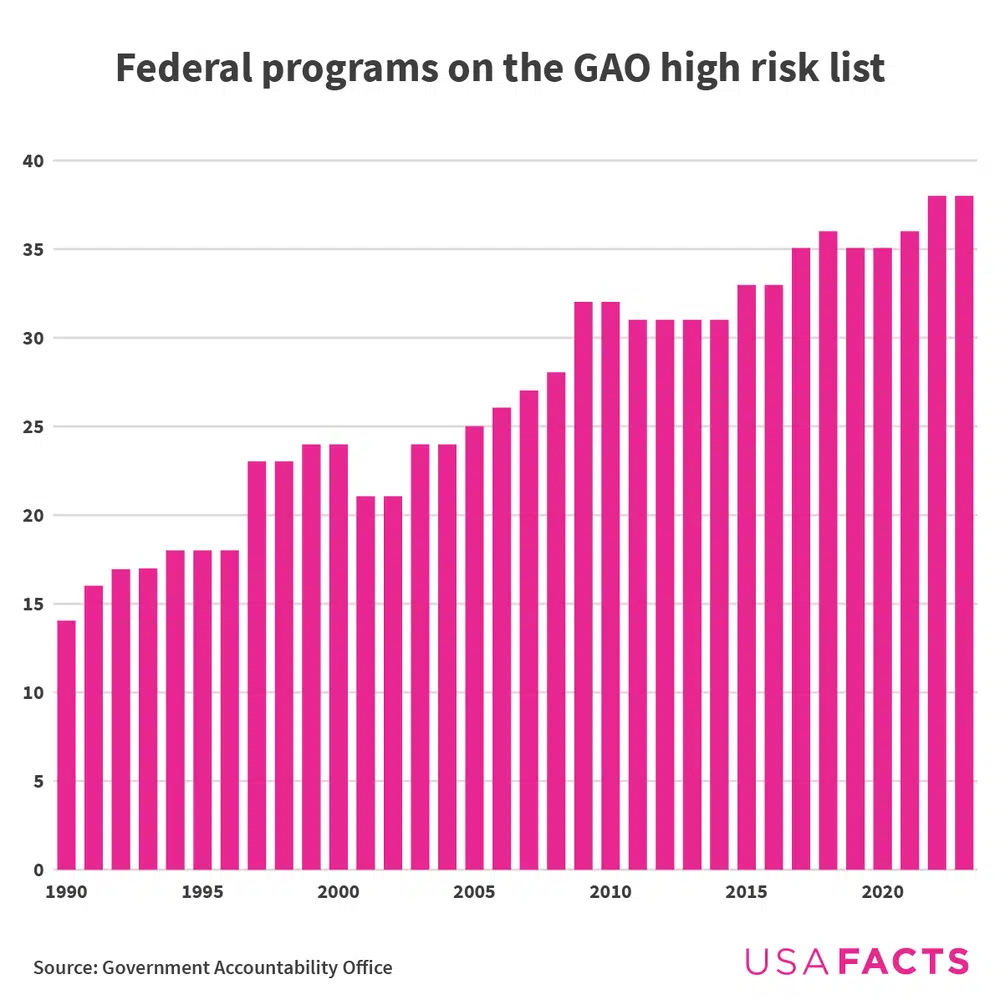
To see more, including the current high risk list, click here.

Tracking guns used in crimes

  • To help understand how guns end up used in crimes, the Bureau of Alcohol, Tobacco, Firearms, and Explosives tracks the time between a gun's last legal purchase and when it's used in a crime. The Bureau even has a name for it: time-to-crime (TTC). USAFacts has the data on how this timeline has shortened since 2018, the types of guns it tracks, the buyers involved, and more.
Bar chart showing the percentage of guns used in a crime one year or less after purchase rose from 19.7% in 2019 to 32.2% in 2021.
  • A short time-to-crime can indicate gun trafficking, as it suggests that the gun was likely purchased with criminal intent. The percentage of guns that were used in a crime one year or less after purchase increased from 19.7% in 2019 to 32.2% in 2021.
  • Twenty-eight percent of traced pistols had a TTC of one year or less — more than double the percentage for shotguns (13%) and revolvers (11%). Rifles had a time-to-crime of 20%.
Bar chart of traced crime guns by age.
  • By age group, buyers 18 to 24 had the highest share of guns recovered within a year: 37%. The ATF traced 22% of crime guns to minors (who cannot legally buy guns) within a year of their purchase.
  • Thirty-six percent of guns traced to female buyers were used in a crime within one year of purchase; the rate was 24% for male buyers.
Bar chart of the top five and bottom five states for TTC. Hawaii had the longest, 7.5 years;  Virginia, the shortest: 1.6 years.
  • The median TTC for traced crime guns varies widely by state. Hawaii had the longest period, 7.5 years. Virginia had the shortest: 1.6 years.

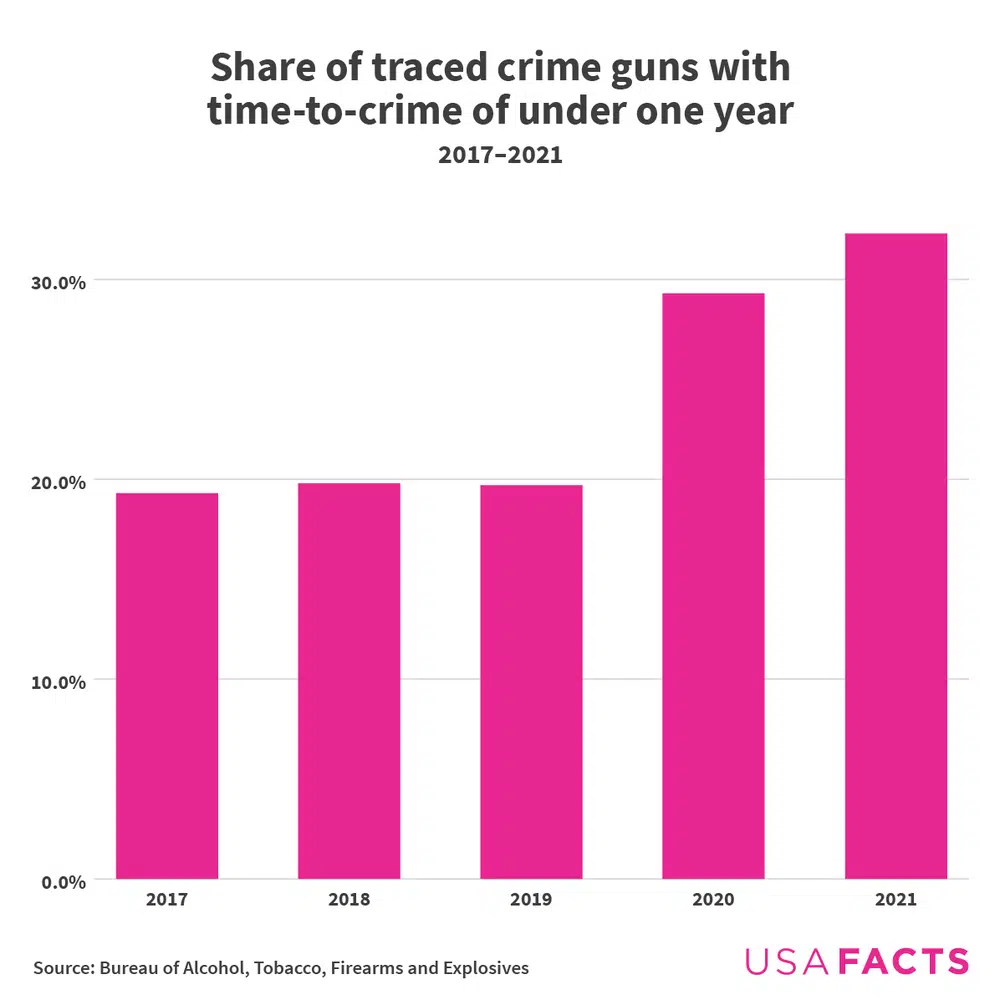
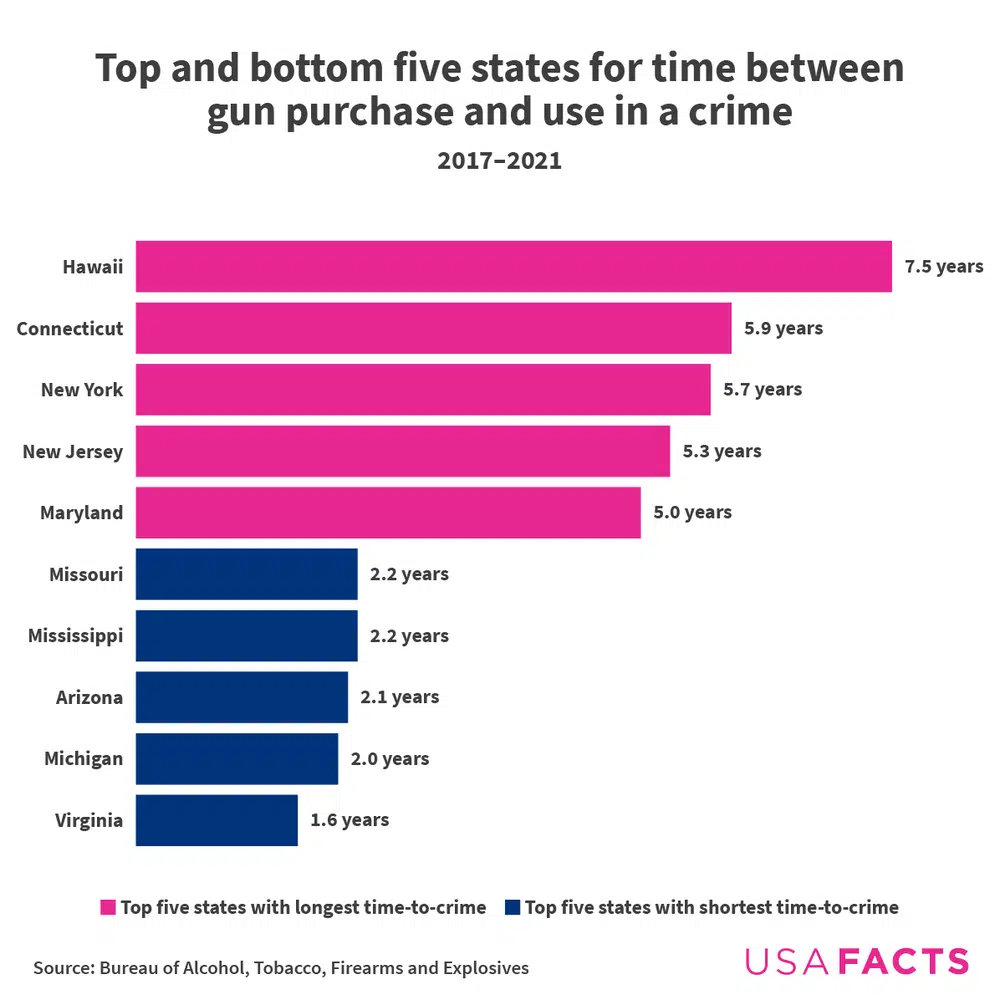
Read more about the length of time between a gun’s purchase and its use in a crime plus the buyers and possessors of guns.

Data behind the news

On Monday, JPMorgan Chase announced it would buy most of First Republic Bank after the latter bank failed. Here’s a refresher on the history of US bank failures.

The NFL draft was last week. And while the league does not stipulate that draftees must have attended college, virtually all of them have. USAFacts has this 2020 look at what football means for universities' bottom lines.

Take the newest weekly fact quiz here!

Data behind the news

Chart showing the taxes the federal government levied to collect an average of $15,098 per person to federal revenues in 2022.

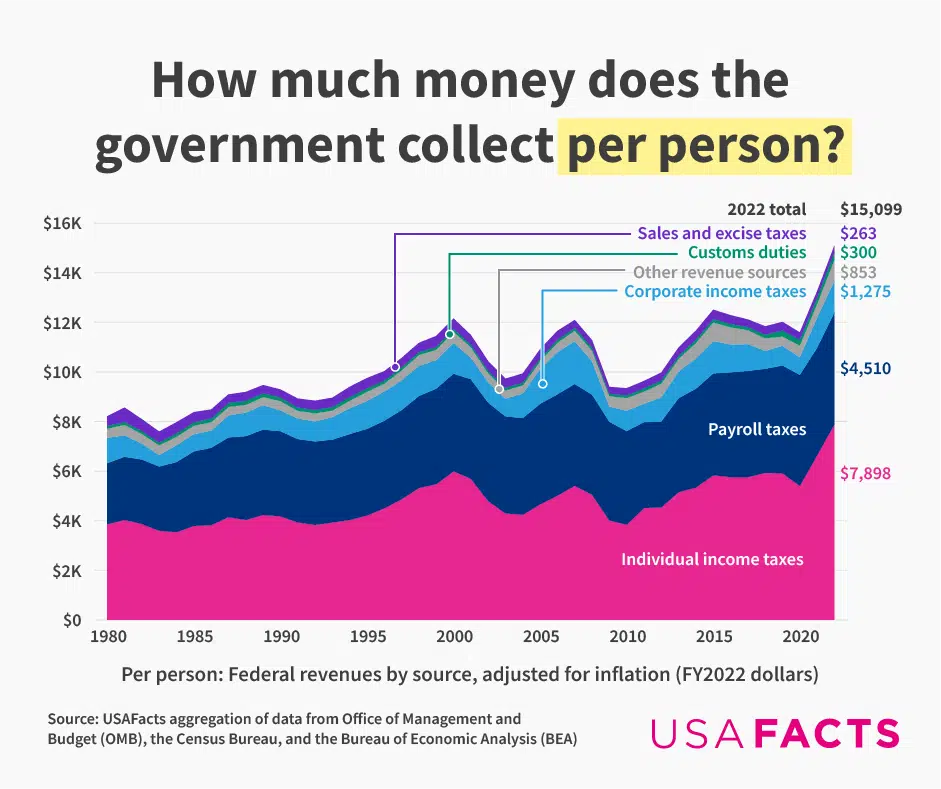
The federal government collected $5.03 trillion in revenues in 2022 (adjusted for inflation), up $630 billion from the previous year. Americans contributed an average of $15,098 per person to federal revenues — nearly double what they paid 40 years ago.

According to a Congressional Budget Office report, federal revenues grew in 2022 due to increased individual income tax collection. Despite recent changes to the tax code, roughly 40%–50% of federal revenues come from income taxes.