Home / Articles / Weekly US Government Data Roundup: June 5, 2023

Is Social Security sustainable?

Declining birth rates mean fewer people are paying for Social Security while the older adult population is growing. This doesn’t mean that funds will necessarily run out, but the program could become insolvent if Congress doesn’t act. Here’s how the population has grown and what it could mean for the program.  

US age distribution by gender from 0 to over 85
  • The median age of a US citizen rose from about 28 years old in 1970 to 39 in 2020.  
  • Almost 67 million people currently rely on Social Security payments. Baby boomers began qualifying for Social Security in 2008. Between then and 2022, Social Security recipients have grown by more than 15 million.
The Social Security budget surpluses and deficits. Deficits started in 2021.
  • Since 2010, the combined Social Security trust funds (Old-Age and Survivors Insurance and Disability Insurance) have slowly diminished, mostly due to an aging population and weak economic growth after the Great Recession.
  • According to projections, the two funds could be depleted by 2035. If this happens, the Congressional Budget Office estimates that Social Security payments might only cover 80% of the scheduled benefits. This could mean reduced payments for beneficiaries.

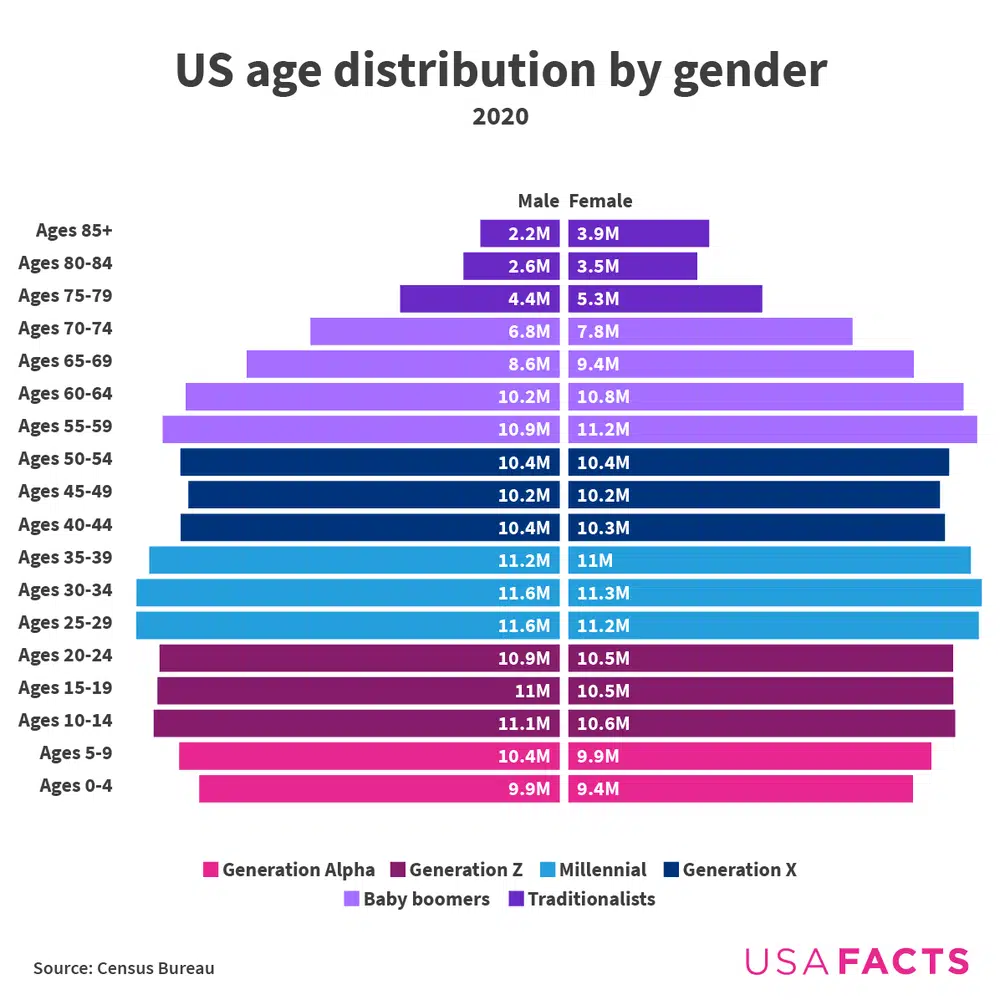
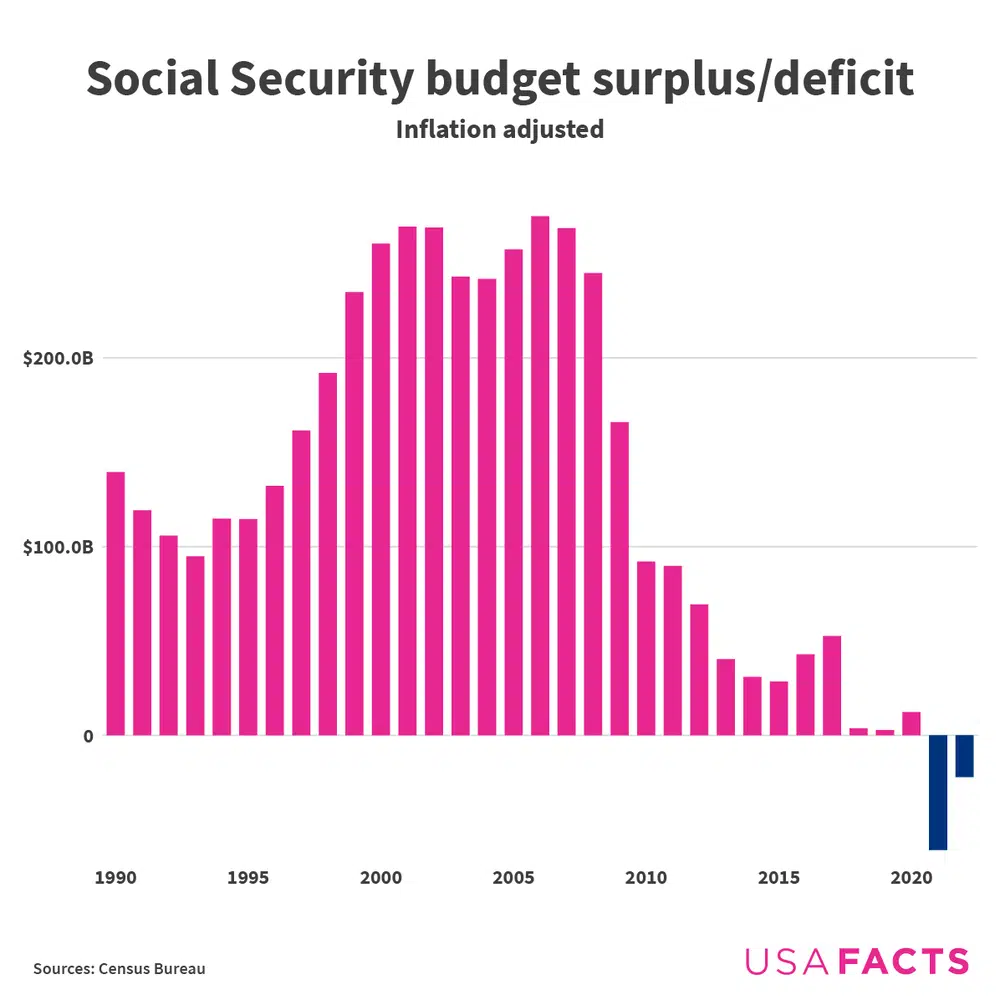
See more about the growing population for Social Security benefits.

The nation’s most competitive housing markets

When many people are on the market trying to buy a home, houses tend to get snapped up quickly. A low median number of days on the market for available homes indicates high demand for houses. Nationwide, homes sat on the market for an average of 65 days during the first three months of 2023. But which US cities have the most competitive housing markets? USAFacts looked at housing markets through two angles: days for sale and active listings.

A map of median days on the market for home markets nationwide.
  • In the first three months of 2023, the median time for houses on the market in Rochester, New York; San Jose-Sunnyvale-Santa Clara, California; and Manchester-Nashua, New Hampshire, was less than 40 days.
  • Nebraska and Iowa’s Omaha-Council Bluffs market is the most supply-constrained housing market in the country. In the first quarter of 2023, it averaged only 0.75 active listings per 1,000 households, well below the national average of 4.59 per 1,000.
  • Three of the five most supply-constrained metro areas are college towns: Cape Girardeau on the Missouri-Illinois border, South Bend-Mishawaka on the Indiana-Michigan border, and Ithaca, New York. All had fewer than 1.25 homes on sale per 1,000 households.
  • The southern US housing market generally has more houses for sale; three of the top five cities for homes for sale are in Florida. One had as many as 20.9 homes for sale per 1,000 households. Conversely, many West Coast and larger Midwestern cities have constrained housing supplies.

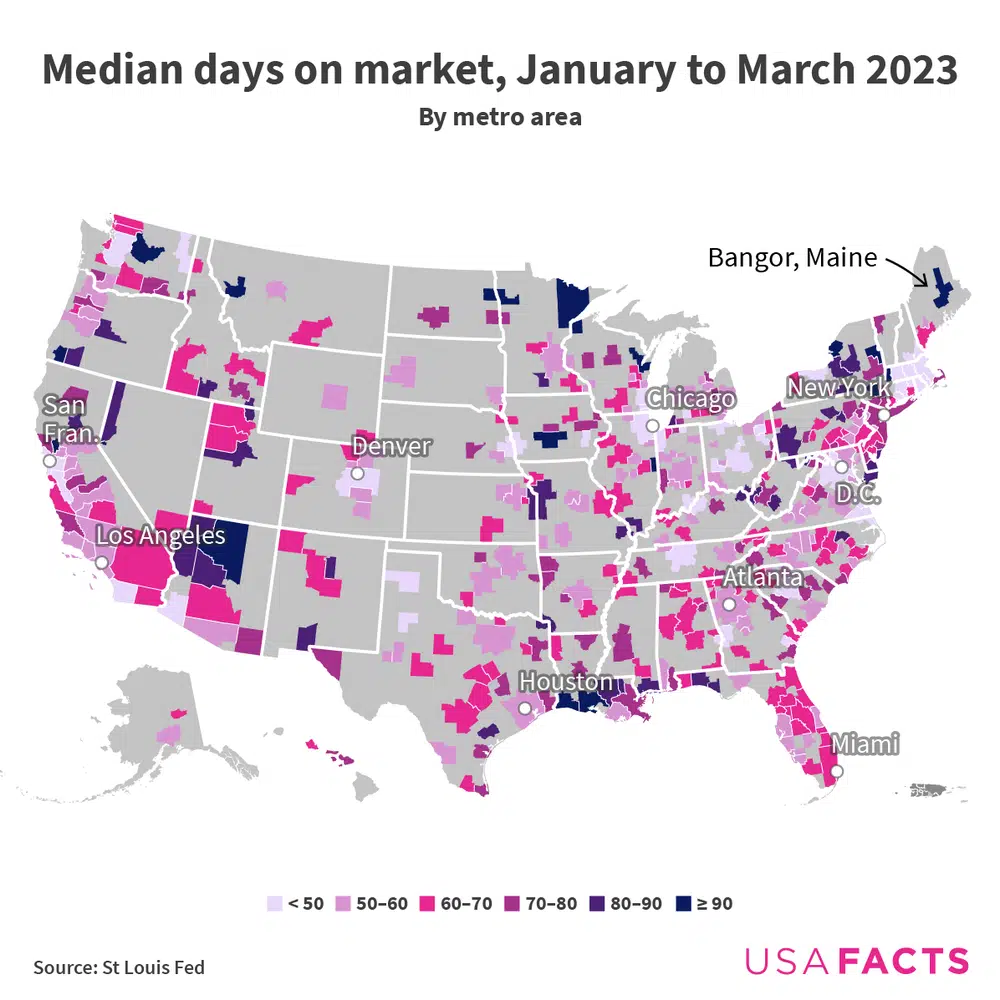
See more about specific metro areas. Plus, in most of the Western US — and almost all predominantly urban counties — an average earner could not afford to buy a median-priced home within their county in 2022. Explore these maps detailing where home prices are rising faster than wages for more.

Data behind the news

The Atlantic hurricane season started on June 1 and will run until November 30. This 2022 article detailed how the National Oceanic and Atmospheric Administration predicts hurricanes.

Sharpen your (digital) pencils — it’s time for the weekly fact quiz.

One last fact

The wait time for affordable HUD housing was 18 months long in 2010. In 2022, it was 25 months.

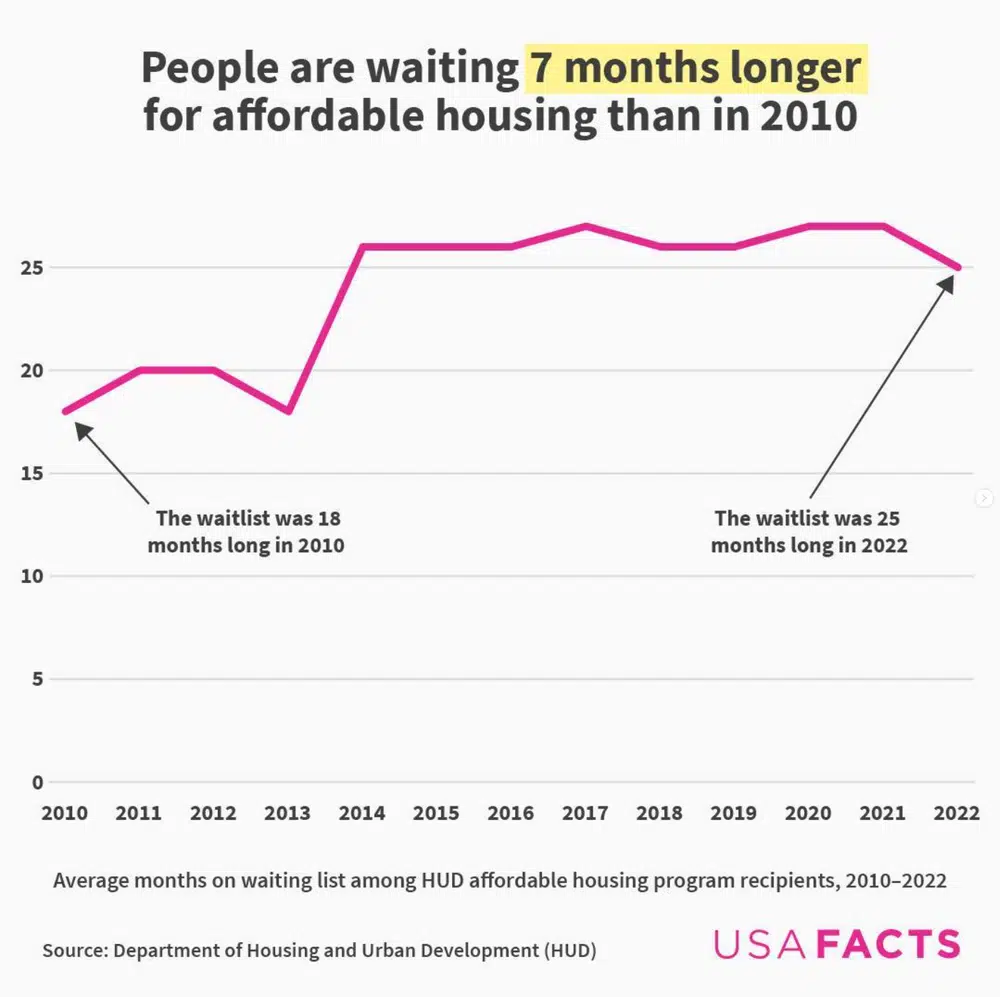
Wait times for affordable housing increased from 2010 to 2022. At the same time, the government cut spending on affordable housing by more than half. Last year, new admissions to the Department of Housing and Urban Development’s affordable housing program waited seven months longer than they did in 2010.

People are also staying years longer in HUD housing. See by how much here.