Home / Articles / Weekly US Government Data Roundup: April 10, 2023

Understanding tax burdens and much more

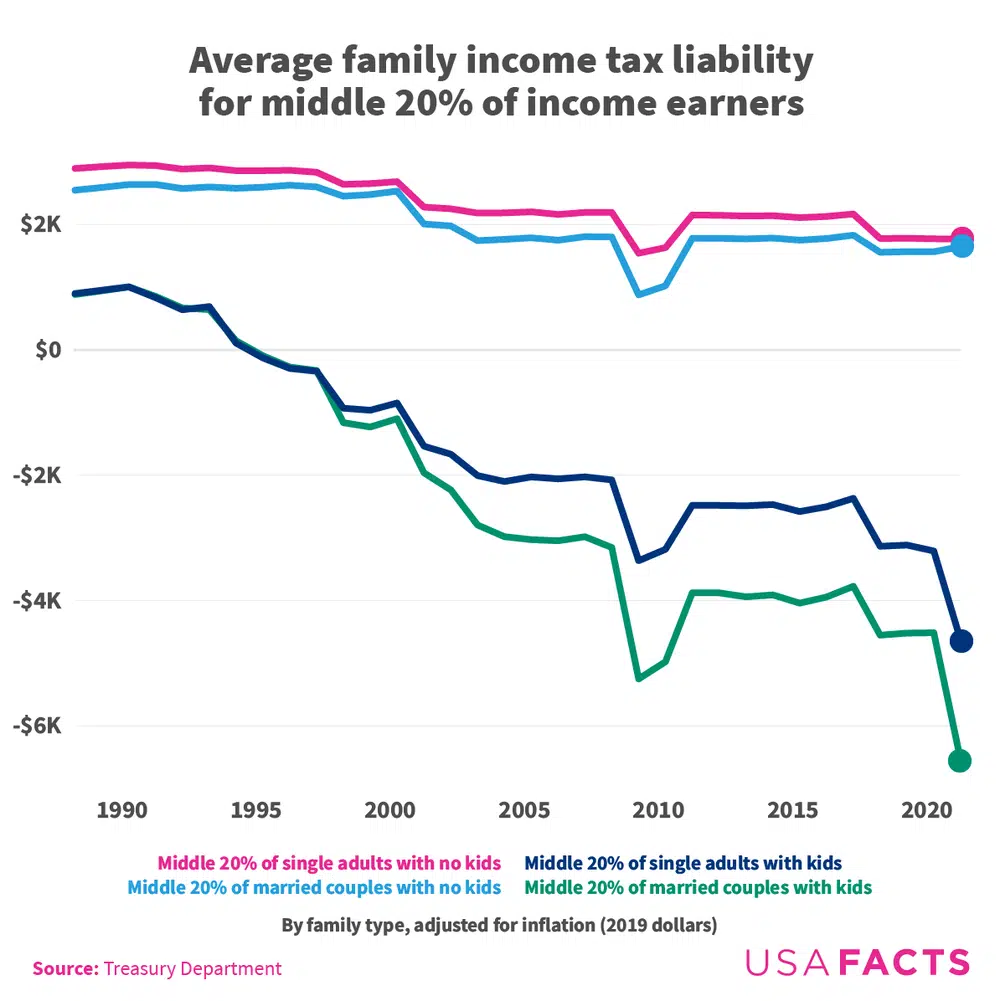
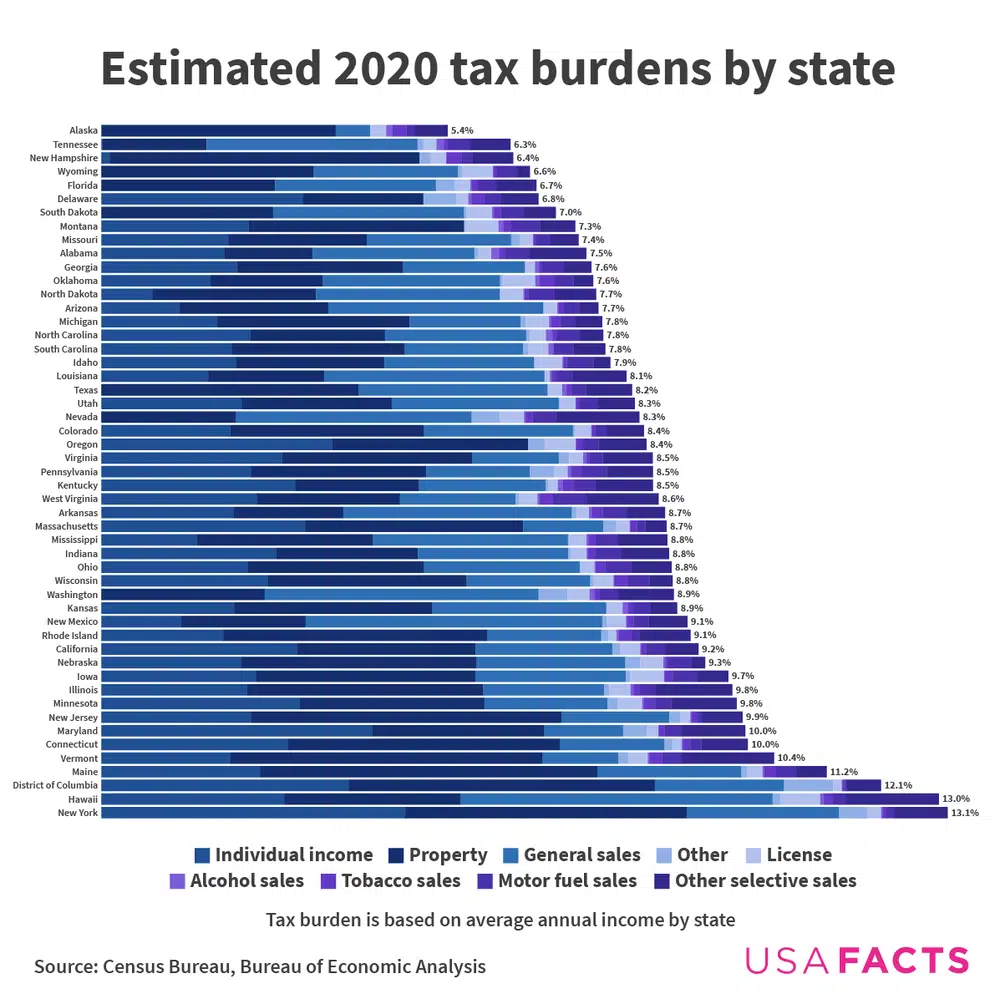
Tax Day is a week away. USAFacts has a bevy of data on the tax systems from different angles, including explanations of tax burdens and various credits for filers. Here are some of the most popular tax articles and data we have available right now.

taxes for families
  • In 2021, the average family income tax liability was $9,165 (when adjusted to 2019 dollars).
  • President George H.W. Bush signed the Omnibus Budget Reconciliation Act in 1990. The law increased the top income tax rate from 28% to 31%. Three years later, President Bill Clinton signed a bill to raise the top rate to 39.6%. 
  • The 2017 Tax Cuts and Jobs Act reduced the average tax bill by approximately $900. On average, families in the middle 20% of income earners with children saved twice as much as single taxpayers in the same bracket.
tax burden by state
  • Feel like you're paying high income taxes in your state? Then take a look at this interactive visual on tax burdens. In 2020, New York and Maryland collected income taxes amounting to more than 4% of personal income. Seven states don't collect income taxes — visit USAFacts to see which ones. 
  • States without income tax don't necessarily have low tax burdens (Alaska and Tennessee are exceptions). They instead impose high taxes on what people buy or the property they own. Washington and Nevada don't collect income taxes but have average to above-average tax burdens.
2023_04_06_2@2x
  • Last year's Inflation Reduction Act expanded tax credits for electric vehicles. Four states also have a state income tax credit similar to the federal program. Maryland, Washington state, and Washington, DC, offer excise or sales tax exemptions on electric vehicle purchases.

    See that and much more right here. Stay tuned next week for the annual USAFacts 10-K, an accounting of how US governments collect taxes and spend revenue — in other words, what taxpayers get for their money.  

How many teens have carried guns in the past? 

Preventing youth violence requires understanding the risk factors and reasons associated with gun carrying. The Centers for Disease Control and Prevention has data that sheds light on the reasons why some teenagers have carried guns in the past.

  • In data from 2017 and 2019, 6.8% of males and 1.9% of females ages 14 to 17 had carried a gun at least once in the 12 months prior.
2023_04_06_1@2x
  • Twenty-six percent of young males who carried a gun had previously been threatened or injured with a weapon on school property. Same for 21% of males who had been in a physical fight on school property. Twelve percent of female students who carried guns had been in a physical fight at school.
  • Substance abuse was also a factor: 23% of males who had misused prescription drugs at least once 19% of those who recently engaged in binge drinking carried a gun.

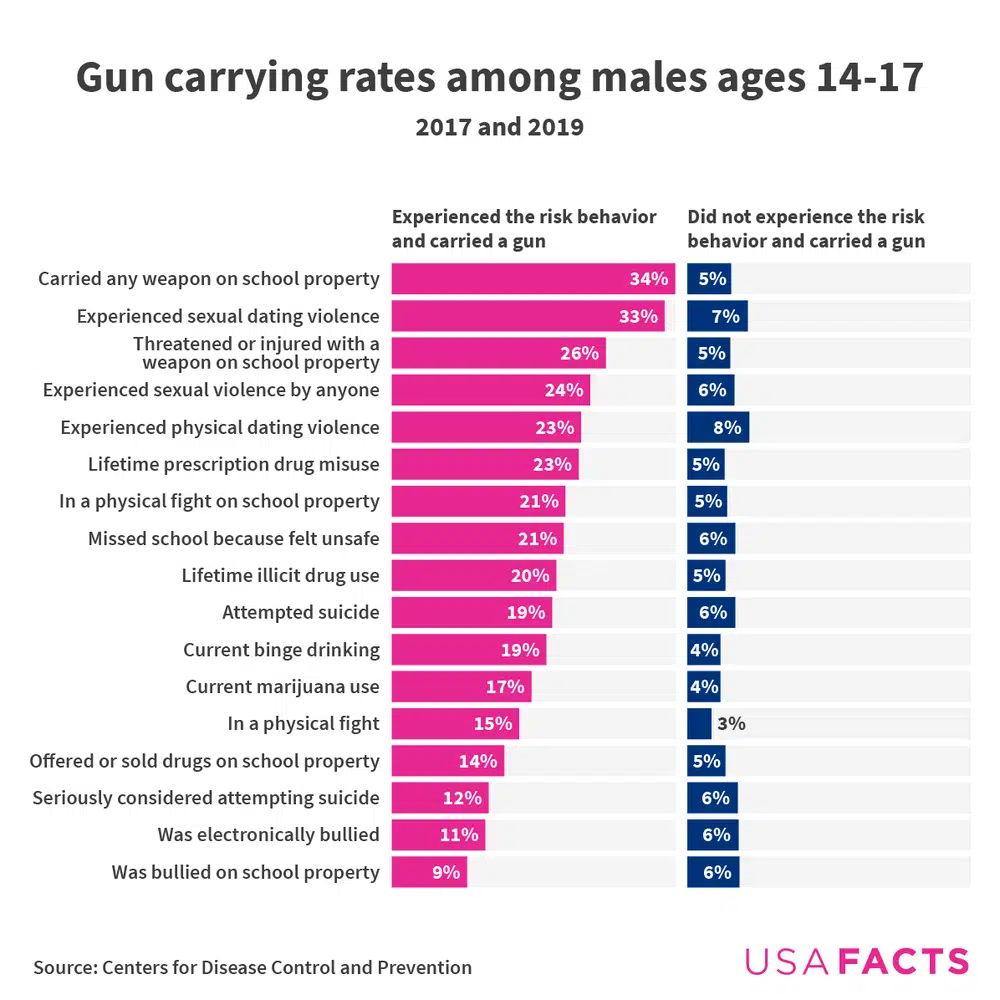
See more risk factors and data breakdowns in this article

Data behind the news

Finland became the 31st North Atlantic Treaty Organization (NATO) member on April 4. How does NATO work, what does it cost to join, and where has the alliance deployed in the past? Read this article for the answers.  

Don't forget to test your knowledge in the weekly fact quiz

One last fact

2023_03_01 SOTU_Coal_IG

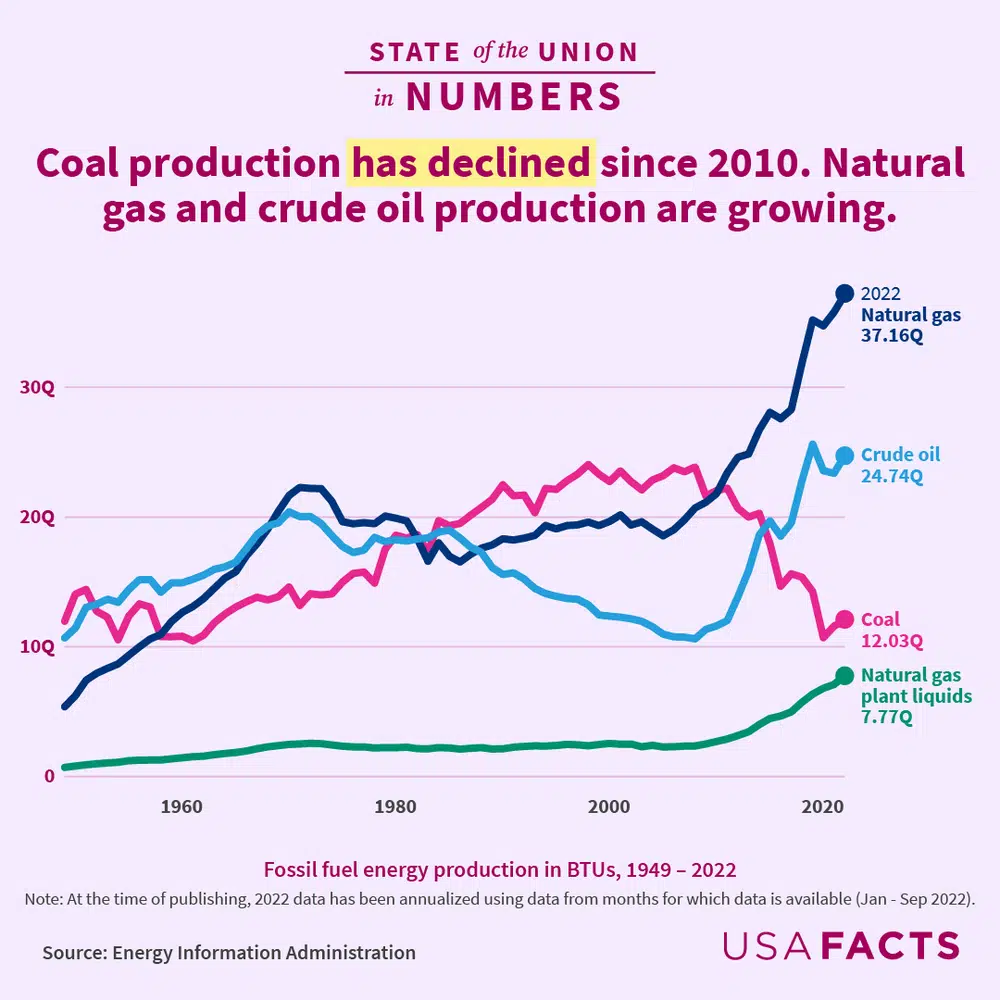
US coal production has declined since 2010. The nation's fossil fuel production increased from 2021 to 2022. Learn more about American energy production and consumption in the State of the Union in Numbers.

Want easy-to-read data like this in your inbox every Monday? Sign up for the USAFacts newsletter.