W.E.B. Du Bois' hand-drawn charts from 1900 show the story of Black Americans through data
The co-founder of the NAACP displayed a series of hand-drawn charts and maps at the 1900 Paris Exposition.
W.E.B. Du Bois was a pioneer in several ways, including being the first Black person to earn a doctorate from Harvard and founding what continues to be a prominent civil rights organization, the National Association for the Advancement of Colored People or NAACP.
He was also a pioneer in the field of data visualization.
For the 1900 Paris Exposition (sometimes also called a world’s fair), Du Bois was the lead organizer of The Exhibit of American Negroes, which examined the status of Black Americans less than four decades after the end of slavery. In addition to displaying photographs related to Black lives, the exhibit also featured two series of data visualizations researched and designed by Du Bois and his students at Atlanta University, which is now Clark Atlanta University. Government sources, including the US Census and the then-Bureau of Labor, figured prominently in the dozens of hand-drawn charts that are now housed at the Library of Congress
Get weekly insights
Subscribe for data-driven insights. No spin, just the facts.
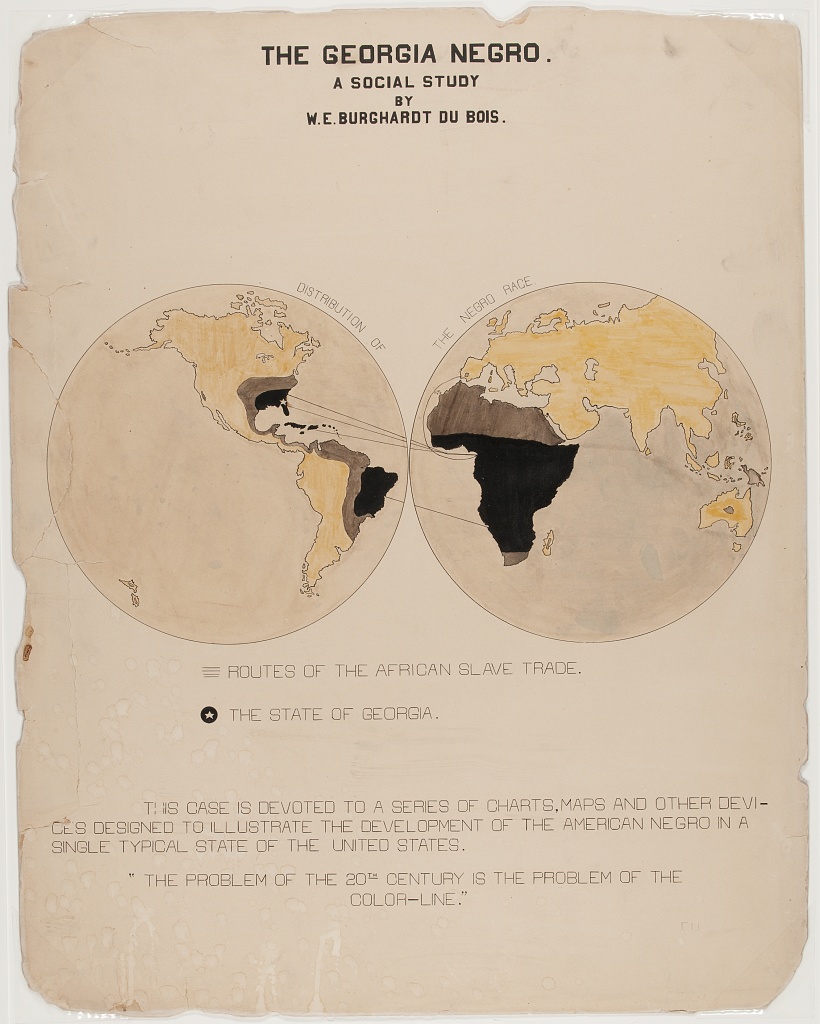
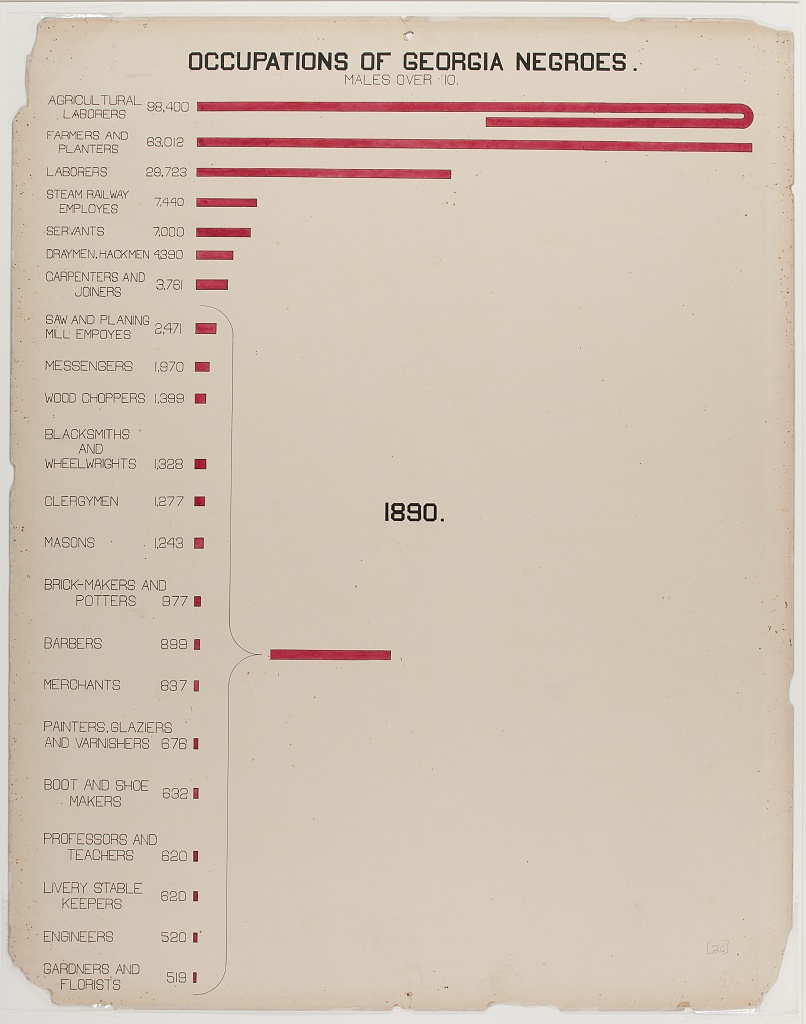
The first series, “The Georgia Negro,” focused on the state with the highest population of Black people at the time. “This case is devoted to a series of charts, maps and other devices designed to illustrate the development of the American Negro in a single typical state in the United States,” Du Bois wrote in an accompaniment to the opening visualization of the exhibit: a map illustrating the African slave trade.
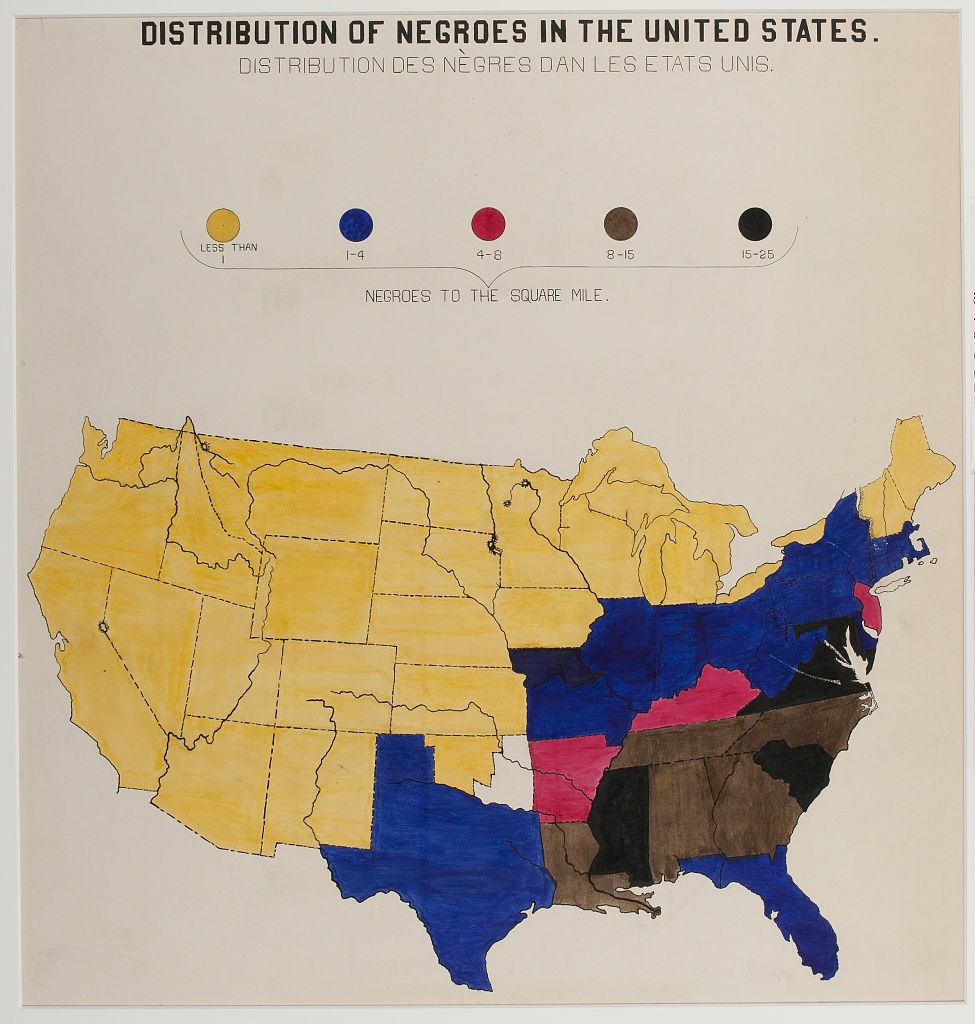
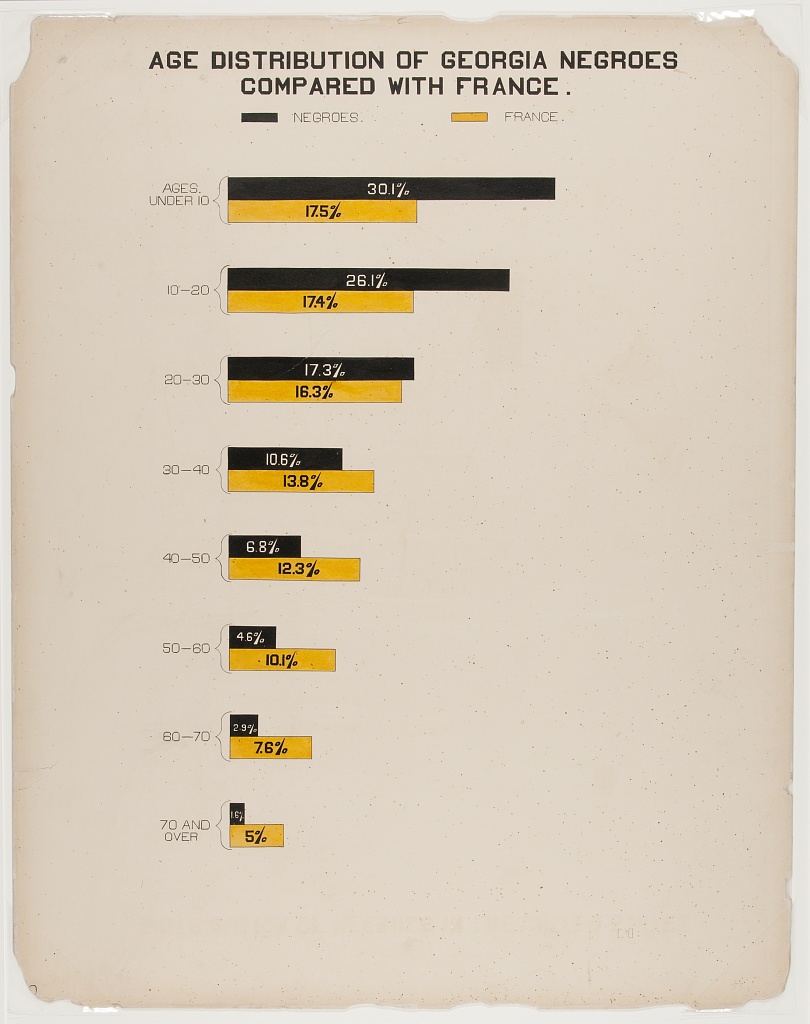
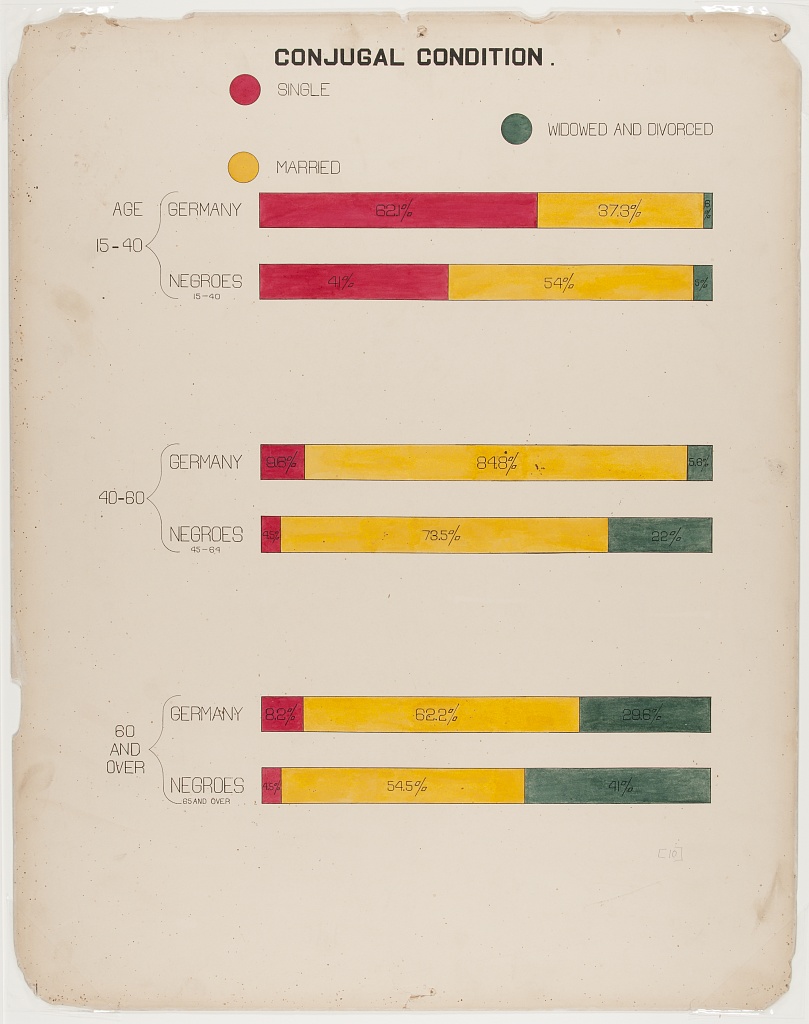
A number of the charts focused on population and demographics, including comparing Georgia’s Black population to those of other states, their age distribution compared with the age distribution of French people, and their marital status compared with German people.
The series also delved into topics including education, wealth, and the occupations of Black Georgians.
The second set of visualizations, entitled “A series of statistical charts illustrating the condition of the descendants of former African slaves now in resident in the United States of America,” offered a wider view of Black Americans.
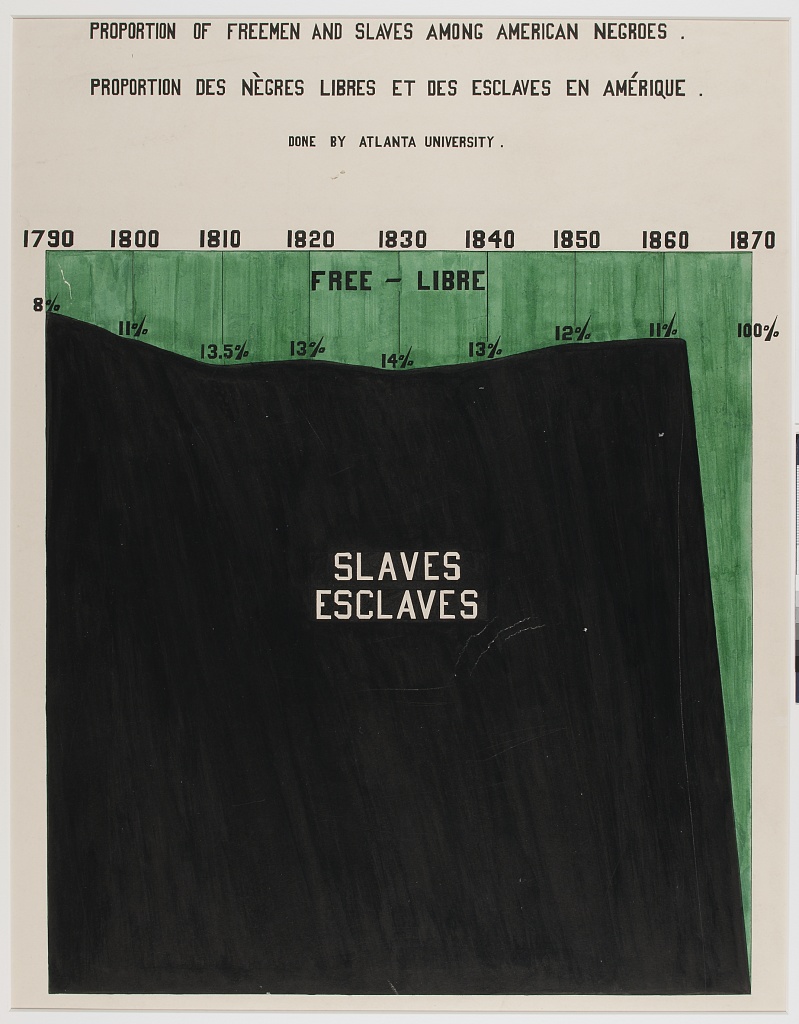
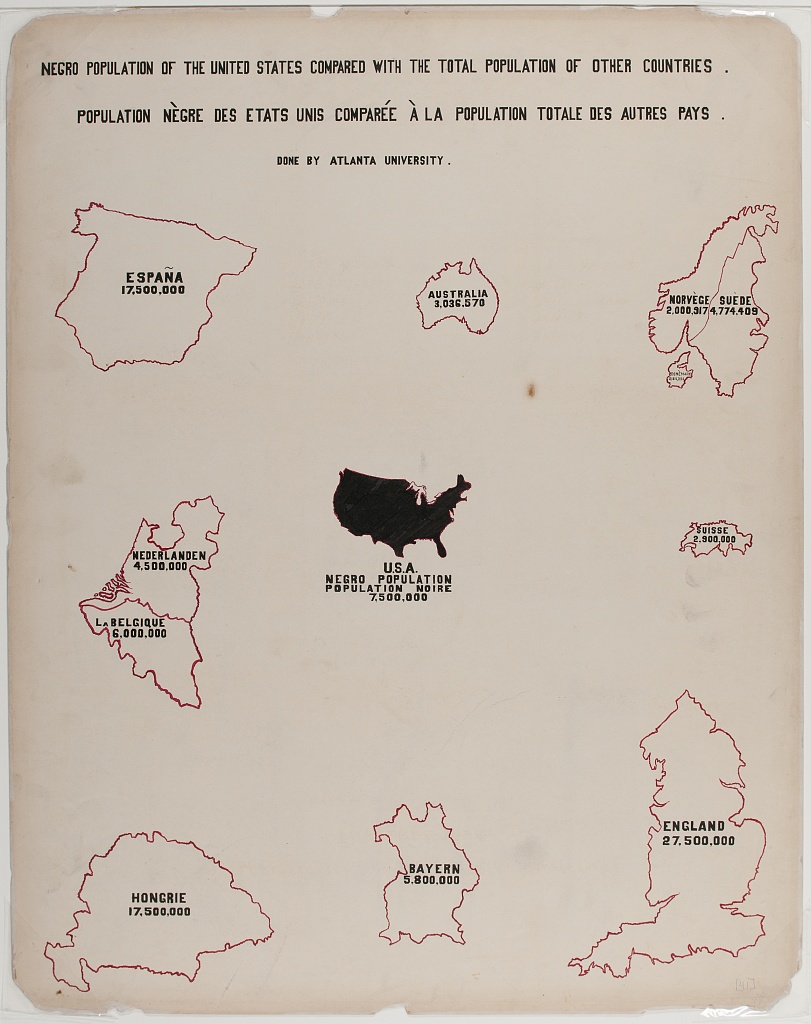
In an essay about the exhibit, Du Bois wrote: “At a glance one can see the successive steps by which the 220,000 Negroes of 1750 had increased to 7,500,000 in 1890; their distribution throughout the different States; a comparison of the size of the Negro population with European countries bringing out the striking fact that there are nearly half as many Negroes in the United States as Spaniards in Spain.”
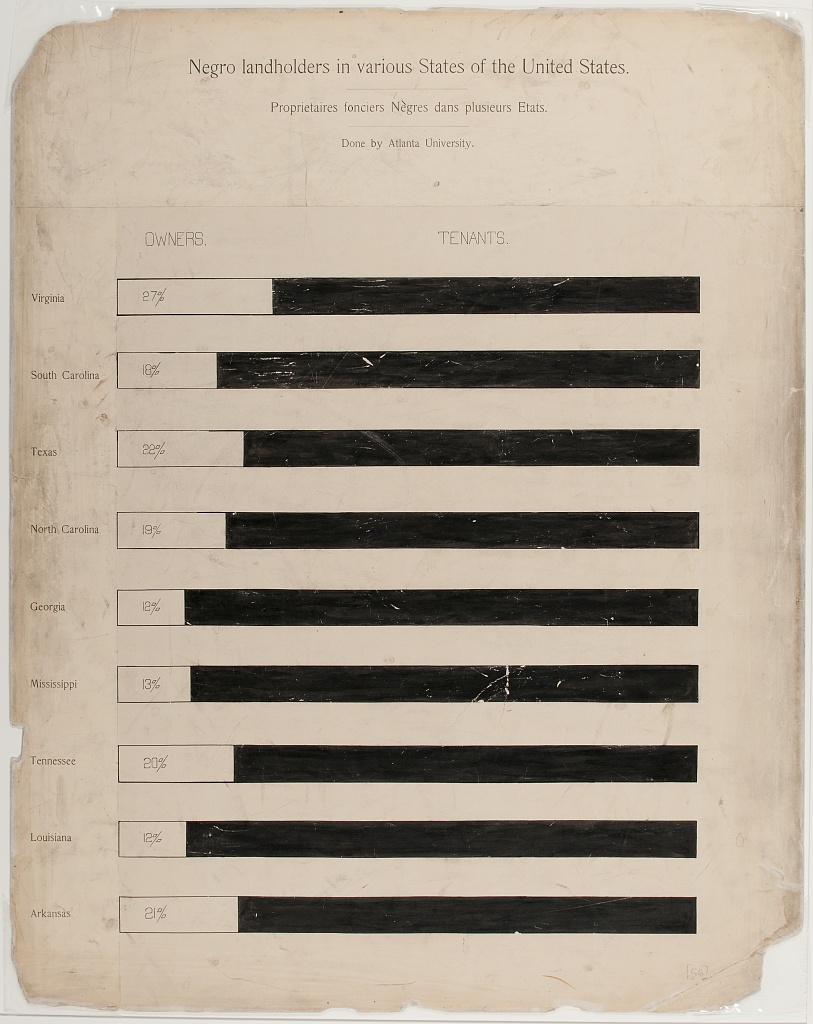
While several of these charts featured population and demographic data, others focused on the economic status of Black Americans. One chart showed the share of Black landowners and tenants in Southern states.
Du Bois’ works were an early example of how data can provide context about issues including demographics. That practice continues to this day, as government data helps illuminate demographic imbalances in health, wealth, and homeownership.
Learn more from USAFacts and get the data directly in your inbox by signing up for our newsletter.
Keep exploring
Page sources
Library of Congress
African American Photographs Assembled for 1900 Paris Exposition
