Semiquincentennial snapshot: the US at 250 years
Insights about the nation's population, households, education, employment, and income.
This July 4 will be the 250th anniversary of the signing of the Declaration of Independence and the nation’s founding. It’s also known as the nation’s semiquincentennial (quincentennial = 500 years, and semi = half, so “semiquincentennial” means “half of 500 years”).
So, who are Americans in this historic moment? Here’s a semiquincentennial snapshot of the US at 250 years.
The population is growing
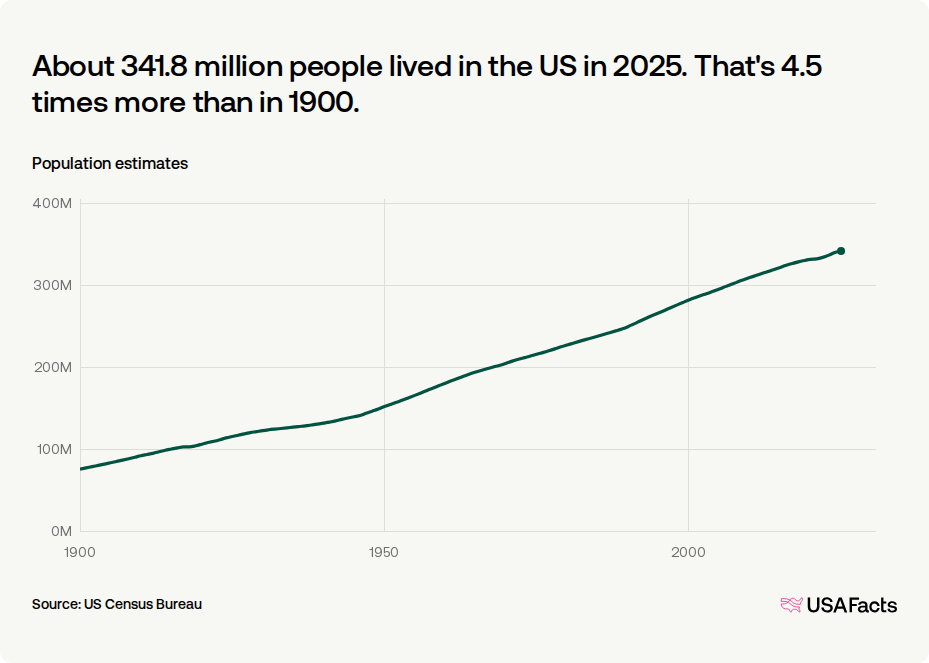
The US reached a record highest recorded population in 2025, with 341.8 million people calling it home.
As of June 2026, the US was the world’s third most populous country behind China (1.41 billion people) and India (1.43 billion).
Although the country’s population has grown for over a century, the pace has recently slowed — a trend driven by lower birth rates, an aging population, and shifting immigration patterns.
About 341.8 million people lived in the US in 2025. That's 4.5 times more than in 1900.
Estimated resident population of the United States, 1900–2025
Immigration is the primary driver of population growth
The US population is influenced by two factors:
- Natural population change: If births outnumber deaths in a given year, natural population growth is positive. If deaths exceed births, it’s negative.
- Immigration: Population change from immigration is positive if more people move to the US than move out, If more people move out than in, it’s negative.
Natural population change drove most of the nation’s growth before the COVID-19 pandemic. Immigration has been the driver since 2020.
Between 2024 and 2025 the US gained 1.26 million residents via immigration.
Components of population change from previous year

Births outnumber deaths, but the fertility rate is slowing
The Centers for Disease Control and Prevention defines the general fertility rate as the number of live births per 1,000 women ages 15 to 44. The rate has declined by more than half over the last century.
In 1924, there were 110.9 births per 1,000 women, compared with a fertility rate of 53.8 in 2024, a decrease of 51.5%.
The US fertility rate reached an all-time low in 2024.
Annual births per 1,000 women ages 15–44, 1909–2024

Many American women are also having children later in life. Just over 20 years ago, in 2004, women ages 25 to 29 had the highest birth rate (116.5 births per 1,000 women). In 2024, the highest rate was among women ages 30 to 34, at 93.7 births per 1,000 women.
Overall, birth rates dropped for women ages 34 and younger and increased among those 35 and up from 2004 to 2024.
America’s population is aging
The country’s largest age group is people who are 65 and older. In 2025, 18.9% of people, or nearly one in five people in the nation, were in this age group.
New births hit a record high in 1957 at 4.3 million. People born that year turned 65 in 2022. Since 2022, the population share of Americans 65 and older has increased nearly 7%.
The Social Security Administration expects the number of people 65 and older to continue to grow by 26% over 12 more years, from about 65 million in 2025 to an estimated 77 million in 2035.
The share of Americans 65 and older has more than doubled since 1957.
Share of total US population by age group, 1957–2025

The second largest age group was people 25 to 34 (13.6% of the population). Close behind were people 35 to 44 (13.3%), and 15 to 24 (13.2%).
All other age groups each accounted for less than 13.0% of the population: people ages 55 to 64 (12.1%), children 5 to 14 (11.8%), 45 to 54 (11.7%), and children under 5 (5.4%).
The US is becoming more diverse
In 1990, 75.6% of people in the US identified as white and non-Hispanic. By 2024, 57.5% did, down 18.1 percentage points.
The share of all other racial and ethnic groups measured in the census increased over the same period. The Hispanic share of the population more than doubled from 9.0% to 20.0%, making it the nation’s second-largest racial or ethnic group.
In 2024, 12.6% of the population identified as Black and 6.7% as Asian or Pacific Islander. Another 3.2% identified as “other,” a census category that includes American Indians, Alaska Natives, and people reporting they identity with two or more races.
In 2024, 42.5% of the population was non-white.
Share of the US population by race and ethnicity, 1990–2024

Many Americans are California Dreamin’ or Choosin’ Texas
In 2025, about one in five Americans lived in one of two states: California or Texas.
Around 11.5% of all US residents (39.4 million) called the Golden State home, and another 9.3% (31.7 million) was at home in the Lone Star State.
In 2025, California was the most populous state with 39.4 million people.
Estimated resident population in each state, 2025
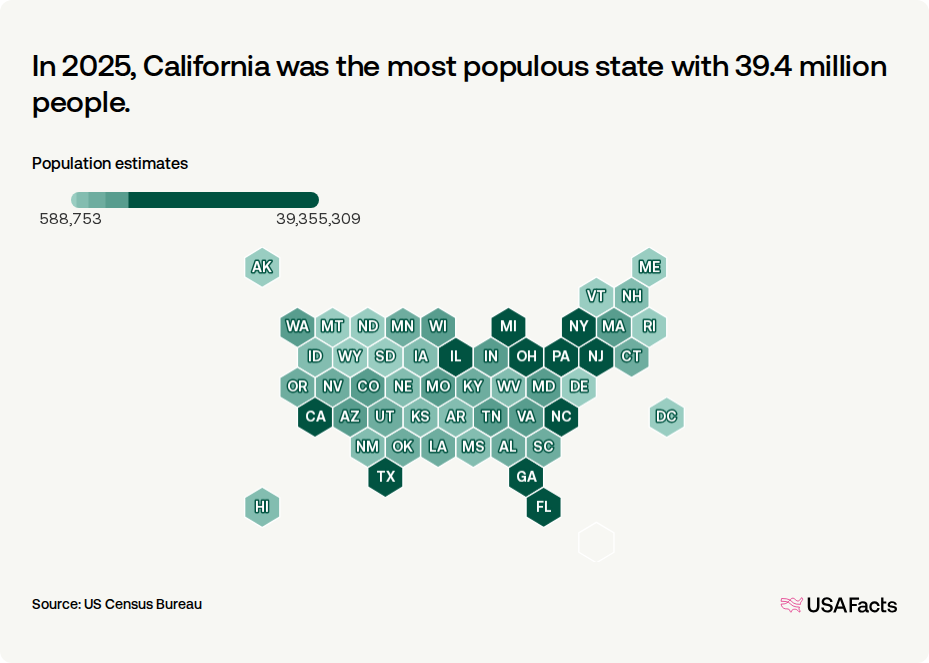
The five most populous states were:
- California (39.4 million people)
- Texas (31.7 million)
- Florida (23.5 million)
- New York (20.0 million)
- Pennsylvania (13.1 million)
And the five least populous states were:
- Wyoming (588,800 people)
- Vermont (644,600)
- Alaska (737,300)
- North Dakota (799,400)
- South Dakota (935,100)
More Americans live alone than ever before
In 2025, for the first time ever, the largest household category was people who lived alone. This was nearly three out of every ten people, or 29.5% of Americans.
Married couples without children under 18 in the home were the second-largest group, accounting for 29.3% of households, nearly identical to the share of people living alone. This group includes married couples who have never had children, and married couples whose children are adults (18 and over).
Solo living topped all household types for the first time in 2025.
Percentage of households by household type, 1960–2025

Households with children under 18 made up about a quarter of all households (24.9%). Of these, married parents headed 17.3% of households, while single parents headed 7.6%.
The remaining 16.3% of households fell into an “other” category, which includes relatives outside of immediate family, and nonfamily households such as roommates and unmarried partners.
Nearly half of adults have a college level education
In 2024, 49.3% of adults age 25 or older held an associate’s degree or higher. The largest share of these adults had completed a bachelor’s degree as their highest level of education (23.7%), the second-largest share was a graduate or professional degree (14.9%), and the share with an associate’s degree was 10.7%. Some adults (14.0%) attended some college but did not receive a degree.
Another 27.8% of adults completed high school, while 8.4% had less than a complete high school education.
In 2024, 49.3% of adults held a higher education degree.
Highest education attainment, adults 25 years and over
The largest work sectors are education, health services, and business
As of May 2026, nearly 27.9 million people worked in private education and health services, making it the nation’s largest workforce.
This sector includes private schools, colleges, universities, and training centers as well as hospitals, ambulatory services, nursing care, and social assistance.
Professional and business services is the country’s second-largest employer (22.5 million people), and leisure and hospitality is third (17.1 million).
In May 2026, private education and health services was the nation's largest industry.
Employment by industry, ranked by workforce size, May 2026

The unemployment rate is hovering above 4.0%
Unemployment was at 4.3% in May 2026. The unemployment rate is the percentage of people in the labor force who are actively looking for work but not currently employed.
This rate is based on the civilian labor force, which includes people who are employed, or who are unemployed but actively seeking work. It excludes retirees or discouraged workers who are no longer looking for work. Part-time workers are counted as employed.
The unemployment rate has been between 4.0% and 4.5% since June 2024.
In May 2026, the unemployment rate was 4.3%.
Seasonally adjusted US unemployment rate, January 2007 to May 2026
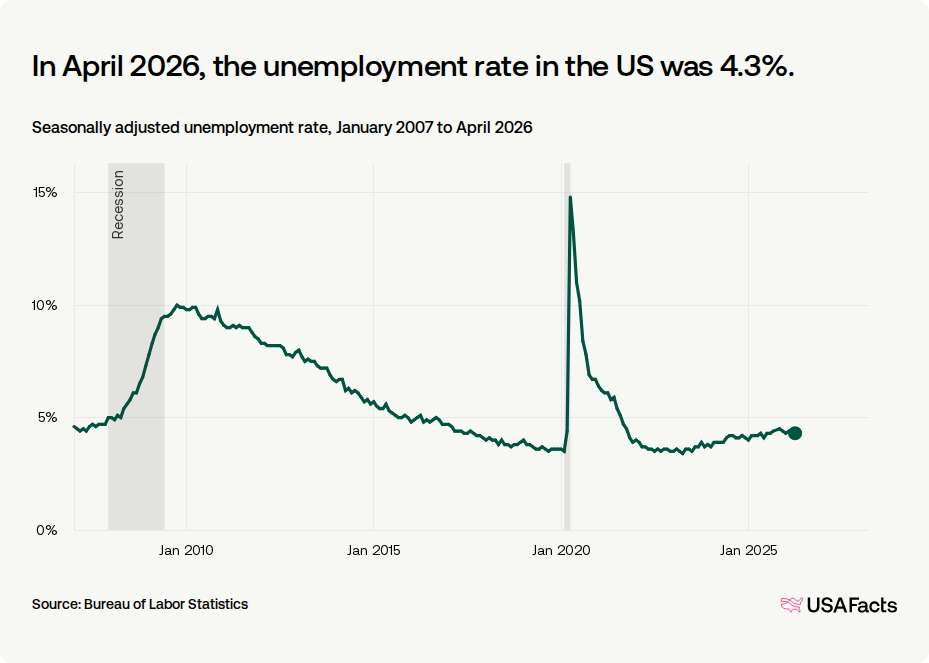
State unemployment rates vary: California, Delaware, and Nevada had April 2026’s highest unemployment rates, each at 5.3%. The lowest unemployment rate was in South Dakota (2.2%).
Most households earn less than $100,000 per year
The median household income in the US was $81,600 in 2024. Household income is the total money received in a year — wages, pensions, investments, public assistance, and more — by everyone in a household over 15.
That same year, nearly three in five (58.8%) households earned less than $100,000 per year. The other 41.2% earned $100,000 or more per year.
In 2024, about 41.2% of households in the US made more than $100K.
Percentage of households in each income group, 2024
This income also varies by the makeup of the household. For example, households ran by a married couple had a higher median income than other types of familial households in 2024.
Among nonfamily households, male householders not living alone had a higher median income than female householders not living alone. For each of these scenarios, a man or woman is the primary person responsible for the housing unit, but shares the residence with one other person, such as a roommate or unmarried partner.
The states with the highest median household incomes were:
- Massachusetts ($104,800)
- New Jersey ($104,300)
- Maryland ($102,900)
- Hawaii ($100,700)
- California ($100,100)
The states with the lowest household incomes were:
- Mississippi ($59,100)
- West Virginia ($60,800)
- Louisiana ($61,000)
- Arkansas ($62,100)
- Kentucky ($64,500)
Learn more about the role of data collection in the US, and get data directly to your inbox by signing up for our weekly newsletter.
Keep exploring
- How many people live in the US?
- Is the US population growing or shrinking?
- What are the most and least diverse states? - The Census Bureau’s formula for measuring diversity shows that every state but one is more varied racially or ethnically since 2020.
- Immigration is down and so are births: Why population growth slowed down - Every facet of population change is contributing to the decline in growth.

