Analyst Notes: How I learned to love the US healthcare system
Or at least, the data we have about it
Over the last six months, I’ve become the most boring person at any party. Why? Because I’ve fallen deep into a rabbit hole researching US healthcare, and I can’t stop talking about it.
It’s an easy trap to lure people into: they ask, “so what do you do?” I say, “I’m trying to understand and explain the US healthcare system,” to which people usually respond, sarcastically, “yikes, how’s that going?” And then I say, “Good, actually. Now buckle in, because seatbelts reduce serious car accident injuries by 50%.”
And then I pause for a chuckle that never comes.
Why am I talking so much about healthcare?
I’m talking so much about healthcare because it seems like everyone else is talking so much about healthcare – specifically, the cost.
Healthcare costs were at the center of two major policy debates in 2025: the One Big Beautiful Bill (which will impact funding for Medicaid – a program that insures a quarter of the population) and the historic 43-day federal government shutdown (which focused on how the expiration of Affordable Care Act (ACA) subsidies could raise healthcare costs for some people). Then, just a few weeks ago, the Trump administration announced that it would send $90 rebate checks to over 20 million eligible Medicare enrollees (total cost: over $1.8 billion) and $500 refunds to nearly 1 million eligible ACA enrollees (total cost: about $500 million).
Get weekly insights
Subscribe for data-driven insights. No spin, just the facts.
Even if you’re not plugged into the policy world, the topic of healthcare costs is still everywhere. I’d be willing to bet that you’ve thought about what you spend on your own health in the past few months, and that at some point in your life you’ve googled “find in-network doctor,” “how much does X procedure cost,” or “weird mole on skin help.”
So, like you, I also have a lot of questions about healthcare, and luckily I actually get paid to answer some of them (though not the weird mole ones). My most pressing question: how much does healthcare really cost us?
One of the best explainers is our Just the Facts video – a series where we break down complex topics using government data. I highly suggest a watch:
If you watched the whole thing (thank you!!) or you skipped ahead to exactly 13:30, you saw that the centerpiece of the video was this chart I made:
Healthcare spending in 2023
By payment type and insurance type
I know, it looks simple. Boring, even. Where’s the drama, the intrigue, something worthy of a 20-minute monologue delivered to an unsuspecting party-goer?
Keep reading.
Love Island USA(Facts): Healthcare Data Edition
Putting this chart together involved way more twists and turns than I expected. The best analogy I could come up with is that this analysis felt much like a reality dating show.
First, I had to narrow what I was even looking for (a step that many reality show participants skip, to their detriment and our entertainment). I wanted to explain:
- how much individuals pay for their own healthcare,
- how much other entities (like employers and the government) contribute to our healthcare costs, and
- how both of these vary by the type of health insurance one has (since insurance dictates so much of what we pay).
Second, I had to dive into the whole wide sea of government data to find out if any dataset could check all these boxes.
Enter contestant #1: The National Health Expenditure Accounts (NHEA)
The elevator pitch: The NHEA is a dataset of 20+spreadsheets showing how payments flow through the healthcare system. Healthcare providers, insurance companies, and the government give the Centers for Medicare and Medicaid Services (CMS) a huge amount of administrative data, which the CMS pieces together with a wave of a magic wand (or something like that) to show where healthcare providers get their money and what services that money pays for.
Greatest strengths: The NHEA gives us a lot of interesting data on healthcare spending, including:
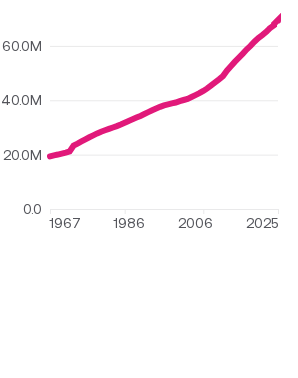
- The total cost of the average person’s healthcare — including spending by employers, the government, and the individual — every year since 1960. Not many datasets go back this far. In 2024, spending reached an all-time high of $13,265 per person (nearly 10 times higher than it was in 1960, after adjusting for inflation).
Total personal healthcare costs per capita
1960–2024
- The total average out-of-pocket spending per person. In 2024, that was $1,637, or 12% of that $13,265. Out-of-pocket spending includes co-pays, deductibles, and money spent on over-the-counter medications and first aid products.
- The total amount that households pay for different types of health insurance, including employer-based, direct purchase, and Medicare (household spending on health insurance is calculated separately from out-of-pocket spending above)
- The total amount that Medicare, Medicaid, and private health insurance companies spend on behalf of enrollees
(If you’re like me, you might be thinking, “isn’t that everything from that sad bar chart above?” and “I thought there would be more drama?” Keep reading.)
Greatest weaknesses: The NHEA, for its many charming qualities, has one major dealbreaker: it can’t separate out-of-pocket healthcare costs by insurance type. The $1,637 in out-of-pocket spending for an average person is as detailed as it gets.
Why does that matter? Let’s take two random Americans, a 70-year-old on Medicare with a chronic illness and a healthy 25-year-old with employer-based insurance. I can be fairly certain that the senior’s out-of-pocket spending was higher than the Gen Z’er, but the NHEA can’t tell us how much more.
To make it sting even more, there were some other shortcomings in the NHEA data:
- It tells us basically nothing about healthcare costs for the uninsured. We still don’t know how much they spend out-of-pocket, nor do we know how much other payers spend on their behalf.
- This may be a “me” problem, but I was annoyed that insurance premiums aren’t considered out-of-pocket spending. I can’t be alone in thinking that “out-of-pocket” should mean “every healthcare expense that I pay with my hard-earned cash” which includes, for most of us, a monthly payment to an insurance company. As it turns out, excluding premiums from out-of-pocket calculations seems like a common health data industry practice (more on that later). The NHEA does also explain this in its documentation, blah blah blah, but I reserve the right to be miffed, especially because these two very related costs are in different spreadsheets, and I really had to dig to find what I needed.

At least the NHEA is honest about its character flaws...
The decision: The NHEA was not The One. Or at least, not the only one. It can give me all spending by other payers (except for the uninsured) and what people pay in insurance premiums for employer-based insurance, direct-purchase insurance, and Medicare. Let’s sum up the progress we’ve made on my graph:

Now, I need to weigh my options to see if there’s one dataset that’s actually the total package.
Enter contestant #2: The Medical Expenditure Panel Survey (MEPS)
The elevator pitch: MEPS has two components. The household component (MEPS-HC) is a nationally representative survey of households that collects data on what people actually spend on their healthcare every year. The insurance component (MEPS-IC) surveys employers to collect data on employer-sponsored insurance plans, costs, and enrollment.
Both of these are different than the NHEA, which relies on administrative data (like claims) provided by healthcare providers. There are pros and cons to every type of data, but for the niche question of healthcare costs by insurance type, we may need the specificity and detail that survey data can offer.
Greatest strengths:
- The MEPS data describes out-of-pocket costs by insurance type (the missing puzzle piece from above!) as well as how much payers like Medicare, Medicaid, private insurance companies, and others spend total and per enrollee (which overlaps with the NHEA)
- The MEPS data also provides out-of-pocket and other costs for the uninsured, which the NHEA doesn’t
- The MEPS has an “other” payers category. NHEA also has an “other” payers category, but it mainly includes federal government and employer contributions to healthcare. The MEPS “other” category includes other other payers not accounted for in the NHEA, like worker’s compensation, the medical portion of home and auto insurance, community health clinics, and other miscellaneous forms of health care. I added the amounts from this “other-other” payers group on top of the NHEA “other” payers group to give a more comprehensive picture of all healthcare spending sources.
- Bonus: We can view the data in multiple ways. MEPS has a handy data tool that lets you look at healthcare spending by different categories, so you don’t have to open an Excel spreadsheet if you don’t want to! Except I always want to, so they also let nerds like me download the full dataset with everyone’s responses (de-identified, of course).

MEPS showing off with its cool data tool
Greatest weaknesses:
- Neither MEPS component covers insurance premium costs for direct-purchase insurance or Medicare (MEPS-IC only includes employer-based insurance plans), so it also can’t be a one-stop-shop for my graph.
- MEPS lags behind the NHEA by about a year, so I only had through 2023 when I initially did this analysis (2024 data has since been released)
- MEPS uses a similar definition of “out-of-pocket” as the NHEA, so this amount is also the “everything but health insurance premiums” variety. And now I know why: the NHEA and MEPS purposely align on their definitions so that each can be used as data integrity check on the other.
(Yes, you read that right. NHEA and MEPS are in bed with each other. You really can’t script this kind of drama. Let the spinoff series commence.)
The decision: MEPS gets a rose, but it’ll have to share the spotlight. Its data filled in crucial gaps in our data puzzle.
Ta-da!

Wait… what’s that little red asterisk?
I know, I made it seem like we were done. But, much like every relationship status I put on Facebook in 2008: It’s complicated.
We need to talk a little bit more about the uninsured. This group is defined as having no insurance plan for the whole year – not even a day – so they don’t have any insurance premium costs (that’s why there’s no dark blue segment in their column). If they need medical attention, they either pay for everything out of pocket (that’s the light blue segment), a free community clinic or charity health program pays for their care (that’s included in the gray segment), or they go into medical debt if they receive care they can’t pay for right away (that’s the asterisk).
A lot of people have medical debt: 15 million Americans had a medical debt collection of over $500 on their credit reports in 2023, according to the Consumer Financial Protection Bureau. Some of this debt will ultimately never be paid; this is called “bad debt.” Healthcare providers often build some bad debt into their financial plans so they don’t get blindsided by shortfalls at the end of the year. But some providers — particularly hospitals that serve a high proportion of uninsured people and Medicaid recipients — will have shortfalls that no amount of financial planning could resolve.
That’s where the government steps in. Medicare and Medicaid set funds aside to reimburse eligible healthcare providers (mostly hospitals) who have high rates of underpayment. In Medicare cost reports from FY 2021, hospitals reported $39.3 billion in charity care and bad debt.
That means I can divide $39.3 billion by the number of people who were uninsured that year to know how much was spent on care for each uninsured person, right?
Wrong. First, that $39.3 billion includes charity care and bad debt for people other than the uninsured population — people with Medicare or private insurance can have high bills too — so using that number would inflate the estimate of spending for the uninsured.
Second, hospitals don’t get reimbursed 1:1 for that $39.3 billion. Medicare paid out $8.3 billion for uncompensated care in FY 2021, and Medicaid contributed $18.9 billion, but Medicaid’s numbers also include payments other than reimbursement for the uninsured, so we still can’t separate how much spending was just for them.
The season finale
At the risk of boring you with more details*, dear reader, I’ll get to the point. I’m 100% confident that federal government spending on the uninsured is at least $1. If we consider what we do know about government spending and the costs that hospitals absorb for the uninsured, it may be in the ballpark of some tens of billions. In the absence of more data that narrows this range, I’ve rounded this to an asterisk. It is, however, safe to assume that the total cost of healthcare for the uninsured in this analysis is an underestimate.
It’s also likely that, across the board, these costs are all somewhat underestimated. One reason is that I didn’t account for any uncompensated care in any group for the reasons described above, so that would add some costs to “other payers” in every group. Another reason is that I did not account for over-the-counter medications or other miscellaneous health purchases that people might make at a drug store. The NHEA calls these expenses “non-durable medical products” and tells us the average cost per person ($353 in 2023). But again, it can’t separate out by insurance type, and MEPS excludes this type of spending from its data collection altogether. So, I reluctantly left this category out.
I wish I didn’t have to end on this disappointing note, but at least we had a wild ride along the way. Which is exactly how I feel about every reality dating show I’ve ever watched.
———
*There are more details, and if you invite me to your next party I will gladly regale you.
