What does the Transportation Security Administration (TSA) do?
The Transportation Security Administration (TSA) is a subdivision of the Department of Homeland Security responsible for ensuring the security of the traveling public in the United States. The agency oversees security operations at airports, including passenger screening and baggage inspection, and works to prevent and respond to threats against transportation systems. It also collaborates with other federal, state, and local agencies to ensure transportation security. It was established in 2001.
$6.7B
7.5%
How much does the Transportation Security Administration spend?
The Transportation Security Administration ranked 5th among Department of Homeland Security divisions in net spending in 2024.
DHS net spending by division, FY 2024

Get weekly insights
Subscribe for data-driven insights. No spin, just the facts.
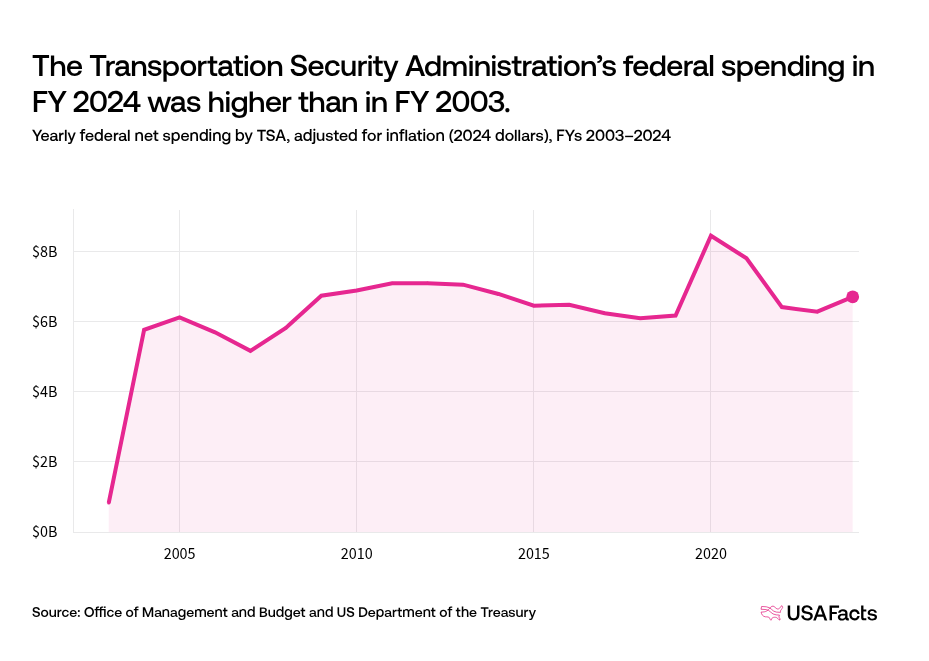
The Transportation Security Administration’s federal spending in FY 2024 was higher than in FY 2003.
Yearly federal net spending by TSA, adjusted for inflation (2024 dollars), FYs 2003–2024
The Transportation Security Administration’s share of federal spending in FY 2024 was higher than in FY 2003.
Net spending by TSA as a share of federal spending, FYs 2003–2024

How did the Transportation Security Administration spend its budget in 2024?
Federal government net spending isolated to TSA, FY 2024

How many people work for the Transportation Security Administration?
The number of federal employees working for the Transportation Security Administration has increased 6.4% since 2010.
Number of federal employees working for TSA, September 2010–2024

Who leads the Transportation Security Administration?
The TSA is led by an Administrator. This individual is appointed by the President and requires confirmation by the Senate. The Administrator reports to the Secretary of Homeland Security. There is no fixed term for this position.
Keep exploring
Methodology
USAFacts standardizes data, in areas such as time and demographics, to make it easier to understand and compare.
Page sources
USAFacts endeavors to share the most up-to-date information available. We sourced the data on this page directly from government agencies; however, the intervals at which agencies publish updated data vary.

