How much federal money goes toward all state and local governments?
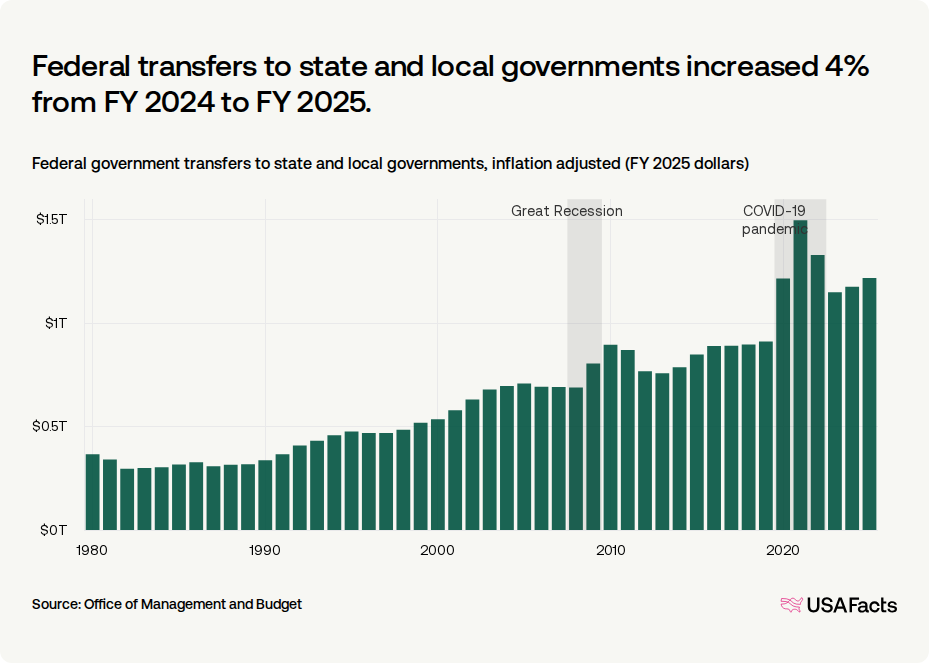
$1.22T
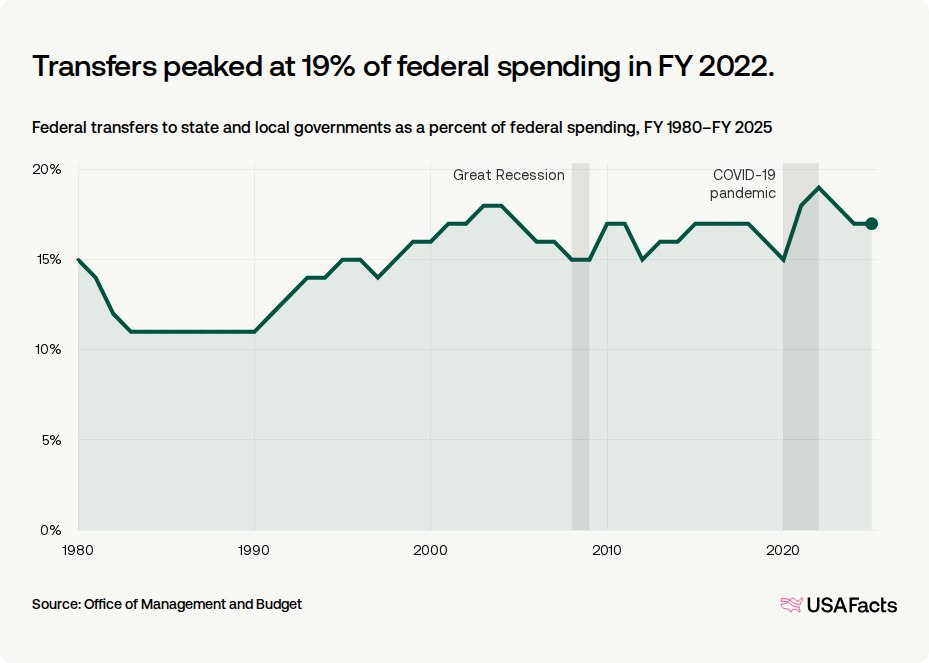
17%
Federal transfers to state and local governments increased 4% from FY 2024 to FY 2025.
Federal government transfers to state and local governments, inflation adjusted (FY 2025 dollars)
What percent of all federal spending goes to state and local governments?
Get weekly insights
Subscribe for data-driven insights. No spin, just the facts.
Transfers peaked at 19% of federal spending in FY 2022.
Federal transfers to state and local governments as a percent of federal spending, FY 1980–FY 2025
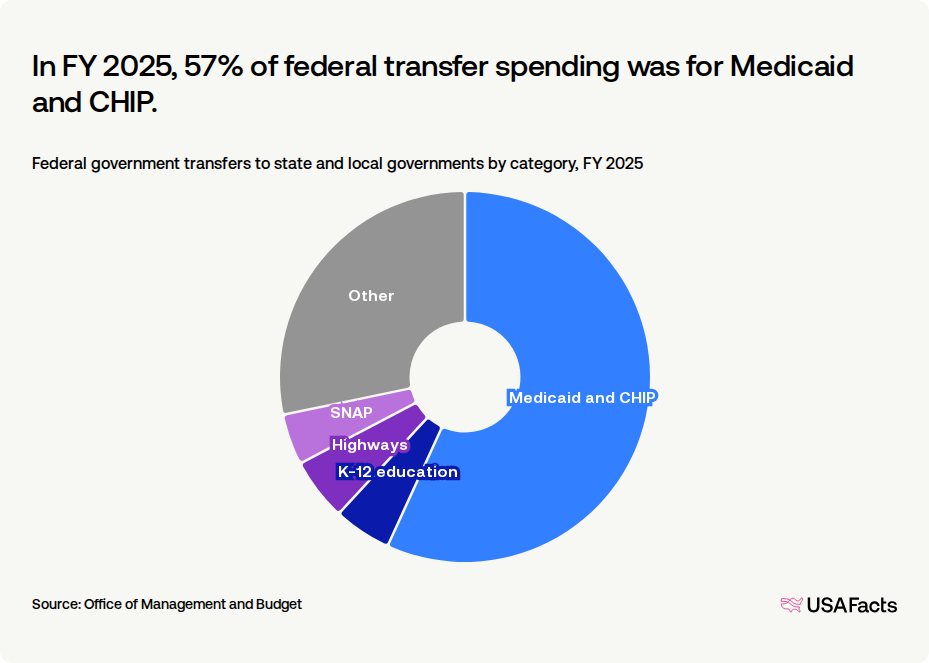
What are federal dollars transferred to state and local governments spent on?
In FY 2025, 57% of federal transfer spending was for Medicaid and CHIP.
Federal government transfers to state and local governments by category, FY 2025
Which states have the highest and lowest share of revenues from federal funding?
Federal transfers made up 20% to 39% of government revenues within states.
Federal government transfers as a share of state and local revenues, FY 2023

Federal transfers to state and local governments, by state (FY 2023)
| 1. | District of Columbia | 39.2% |
| 2. | Louisiana | 36.4% |
| 3. | Arkansas | 35.7% |
| 4. | Arizona | 35.6% |
| 5. | Montana | 35.5% |
| 6. | West Virginia | 35.1% |
| 7. | Kentucky | 34.9% |
| 8. | Alaska | 34.8% |
| 9. | Rhode Island | 33.7% |
| 10. | Mississippi | 33% |
Keep exploring
Methodology
USAFacts standardizes data, in areas such as time and demographics, to make it easier to understand and compare.
Page sources
USAFacts endeavors to share the most up-to-date information available. We sourced the data on this page directly from government agencies; however, the intervals at which agencies publish updated data vary.

