No results found

We're sorry, but there are no results that match your search criteria. Try checking your spelling or using alternate search terms.

We add new data to USAFacts all the time; you can subscribe to our newsletter to get unbiased, data-driven insights sent to your inbox weekly, no searching required.

Subscribe to get unbiased, data-driven insights sent to your inbox weekly.

Topics

Subscribe to get unbiased, data-driven insights sent to your inbox weekly.

Home / Reports / State of the Union / Immigration

Immigration

Authorized immigration to the US rebounded in FY 2022 after declining almost 50% in FY 2020.

Nearly 2.6 million people, nearly the population of Chicago, legally immigrated to the US in 2022. This exceeded the number of new entries in any year from 2018 to 2021, but just below the recent high of 2.7 million in 2016.

Immigration

Excluding tourism and unauthorized arrivals, most people arriving in the US are temporary workers, students, or coming to be with their families.

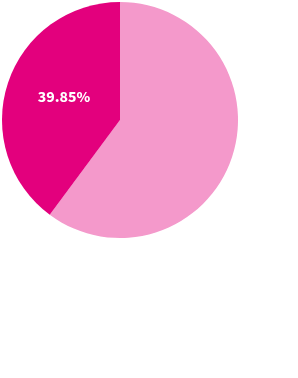
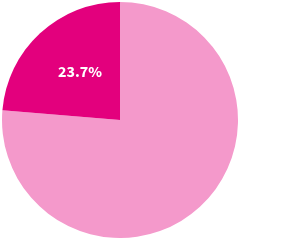
In FY 2022, Mexicans were the largest share of immigrants coming for work (39%), while Indians were the largest share coming to be with family (24%). India were also the highest percentage of people coming for school (18%).

Immigration

Federal immigration and border security spending rose in FY 2023 after two consecutive years of decline following a FY 2020 high.

The government spent $22.4 billion (about 0.4% of all its spending) on immigration and border security last year. After adjusting for inflation, this was the third-highest spending level since at least 1980.

Immigration

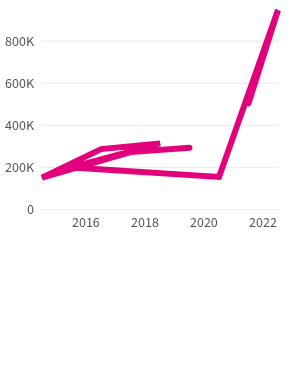
The number of immigrants turned away or apprehended at US borders reached 3.2 million in FY 2023, the most since at least 1980.

More than 2 million immigrants were apprehended illegally entering the US. The remaining 1.1 million were turned away at legal ports of entry by of the Office of Field Operations — more than double the number in FY 2022.

Immigration

Immigration officials removed nearly 109,000 people from the US in FY 2022, the most recent year where data is available. This is the fewest removals since 1996, except for 2021.

About 58% of FY 2022 removals were for criminal offenses, the top three offenses being for immigration, drug, or assault offenses.

Immigration

In 2022, there were about 46.2 million foreign-born people in the US, an increase from 44.7 million in 2018. The federal government estimated 11.4 million unauthorized immigrants were in the country in 2018.

The Department of Homeland Security has not published new data on unauthorized immigrants since providing these estimates in January 2021.

Immigration

About 13.9% of people in the US were foreign-born in 2022.

The foreign-born share of the population rose from a low of 4.7% in 1970, and although the upward trend is slowing, it is higher than any point since the early 1900s.

Immigration

Immigrants are more likely to be in the labor force and a married-couple family than people born in the US.

Also, a higher share of immigrants are between 25 and 54 — the ages when people are most likely to be employed. Fifty-five percent of immigrants are in this age group, compared with 36% of native-born people.

Continue exploring the State of the Union

Explore more of USAFacts