America in Facts 2022: An Annual Report for the Nation
Latest update on June 2, 2022To find solutions to issues affecting the United States, everyone, from regular citizens to top policymakers, needs data to understand how the government is serving the people. This year’s America in Facts report is key to understanding where the nation stands on dozens of issues. It provides metrics and measurements from federal, state, and county records and the context behind that data. Download the report or explore below to see where the nation’s been — and to decide where it should go next.
Government System & Finances
Combined spending for federal, state, and local governments was $6.7 trillion in 2019 (the most recent year for which complete data is available), while combined revenue was $5.8 trillion. Federal government financial data shows its revenue increased by 15% in 2021, driven by higher personal and corporate income tax receipts.
Dive into the report to learn more about US government structure and operations, its employees, and how government revenue and spending have changed over time.

Population
Data from the Census Bureau and other agencies shows that the country’s population is growing at a slower rate than in the past. The population grew 0.1% in 2021, the slowest rate since the nation’s founding, as the death rate increased and immigration slowed.
How many people live in the United States? How did Congressional representation change after the 2020 census? What percentage of Americans are elderly? Dive into the population section of the report to learn more about the people who make up this country.

Economy & Infrastructure
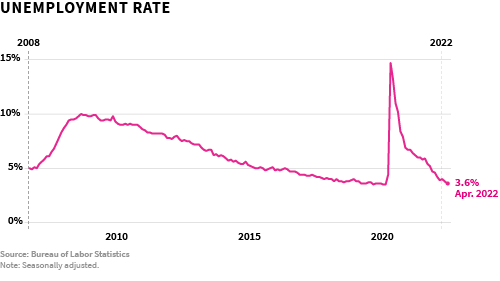
The US economy continued to experience the effects of the COVID-19 pandemic during 2021 and the first half of 2022. In some ways, it’s back on track — GDP increased and unemployment dropped. But there is also some friction. Fewer people are in the labor market and inflation is reducing the purchasing power of raises workers have received. The pandemic has also impacted the nation’s infrastructure and transportation: there were fewer air and public rail travelers last year compared to before the pandemic.
Read the report for more insight into the country’s economy and infrastructure, including what age group has been slowest to return to the labor market after the pandemic recession, and the state of urban and rural roads.
Health
The pandemic has impacted Americans’ health for more than two years. In 2021, the US endured waves of cases, hospitalizations, and deaths. According to the Centers for Disease Control and Prevention, increased mortality from COVID-19, unintentional injuries, heart disease, homicide, and diabetes led to a 1.8-year life expectancy decrease in 2020.
What share of Americans don’t have health insurance? How much does the government spend on public health? How much is spent on personal healthcare in the US? Dive into the health section of the report to see these answers and more.

Standard of Living
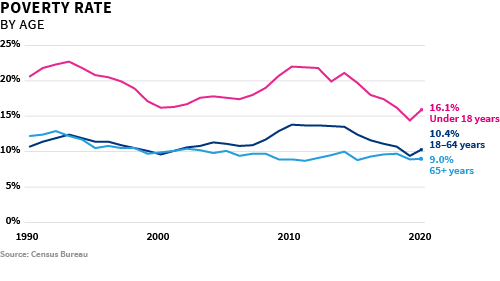
Many people lost jobs and income at the March 2020 onset of the coronavirus pandemic. The poverty rate increased for the first time since 2014 (although it remained below the 2010 high following the Great Recession). Many people also experienced food and housing insecurity, although incidences of both fell in 2021.
Want to know more about the US standard of living? Read this section of the report for details on how much Americans pay in taxes, how poverty varies by race and age, and more.
Education
Sixty-two percent of schools offered full-time, in-person instruction by the end of the 2020–2021 school year. At the start of the 2021–2022 school year, this had increased to 98%. While all the changes the COVID-19 pandemic brought to education are not yet reflected in publicly available data, available information indicates preschool and kindergarten enrollment declined in the 2020–2021 academic year.
What is the high school graduation rate? How much money does the US spend per public school student? How do earnings differ by level of educational attainment? Explore the education section of the report to find out the answers to these questions and more.

Wealth & Savings
The wealth of American families has increased $97.6 trillion since 1990 — or $294,000 per capita. Total wealth among the middle class increased from $5.4 trillion in 1990 to $10.2 trillion in 2021, adjusted for inflation. Despite this, their share of total wealth fell from 12% to 7% during this period.
Read the report’s wealth and savings section to learn about how much people are saving, access and participation in employer-sponsored retirement plans, the pandemic’s effect on wealth accumulation, the cost of Social Security and Medicare, and more.

Energy & Environment
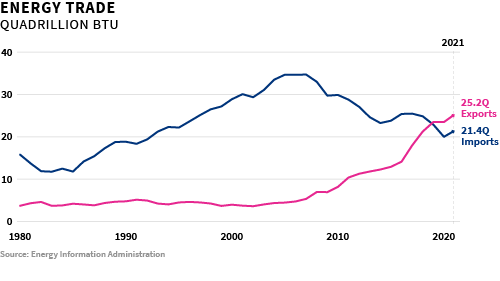
The US increased its net energy exports by 9.8% in 2021. This marked the third year in a row of net energy exports after a period of annual net energy import since 1952. Renewable energy is growing the fastest of all the country’s energy production sources, up 102% between 2000 and 2021.
How warm is the planet getting? How much carbon dioxide does the US emit per capita? What types of energy do Americans use most? Download the report to find out.
Crime & Disasters
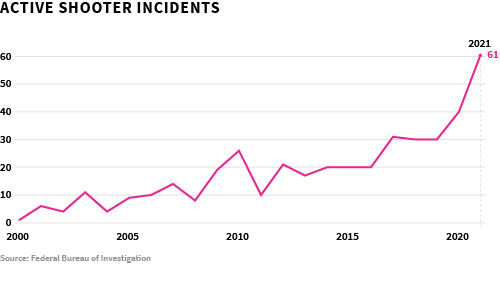
Overall crime rates have declined since the 1990s. Property crime continued to decline in 2020, but violent crime increased by 5.6%. In addition, the number of active shooter incidents has trended upward, reaching 61 in 2021, higher than the previous record of 40 in 2020.
Other crime- and disaster-related questions answered in the report include: How many firearm deaths occurred in 2020? How many police officers are there in the US? And how many acres of land burn in wildfires each year?
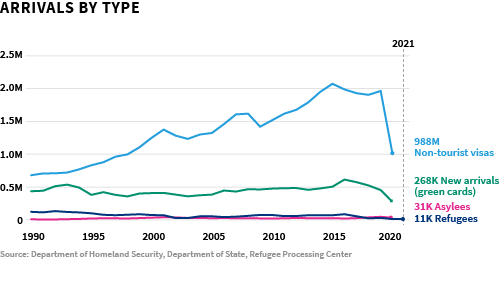
Immigration & Border Security
The latest data on new immigrant entries shows a drop in 2020, likely connected to the COVID-19 pandemic and the Trump administration’s suspension of green cards and certain visas. The annual number of new immigrants fell about 48% from 2019 to 2020.
Why do immigrants come to the US? How many immigrants are in the country? How many people are apprehended or turned away at the border each year? Dive into the immigration and border security section of the report to find out the answers to these questions and more.
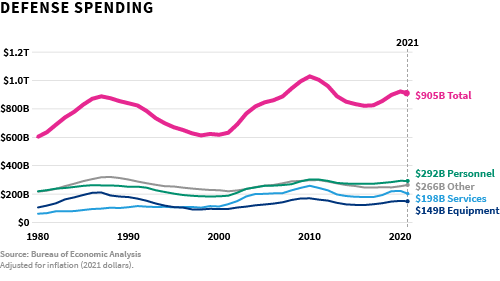
Defense, Veterans & Foreign Aid
The geopolitical landscape shifted in 2021 and early 2022. The United States withdrew all its troops from Afghanistan by the end of August 2021 after nearly two decades of war. And in February 2022, Russia invaded Ukraine. In response, the US deployed thousands of troops to NATO-allied countries and passed legislation providing a total of more than $50 billion in additional aid to Ukraine as of this report’s publication.
Read the report’s defense, veterans and foreign aid section to learn about the number of active-duty troops abroad, the veteran poverty rate, and American foreign aid by country.
Federal Government Actions
Between Congress, two presidential administrations, and executive agencies, the federal government implemented 485 actions to shape policy in 2021. Congress passed 81 bills into law. Former President Donald Trump signed 12 executive orders and presidential memoranda, and President Joe Biden signed 101. Agencies implemented 291 significant rule changes.
Gain a deeper understanding of the bills passed into law in 2021 and more in the report's the federal government actions section.
