- Home
- Just the Facts
- Economy
Is the US economy strong?
How does the government measure the economy? By tracking GDP, unemployment numbers, and the prices people pay for goods and services.
Up Next
Transcript
In this episode of Just the Facts: The US Economy and Your Pocketbook. Let's take a look at the economy and how it is working or not working for you.
Economists measure the economy by looking at what they call the gross domestic product or GDP. It's the market value of all the products and services created in a year by our economy.
Our GDP was over $27 trillion in 2023.
Let's look at growth, “real growth” which is GDP growth adjusted for inflation.
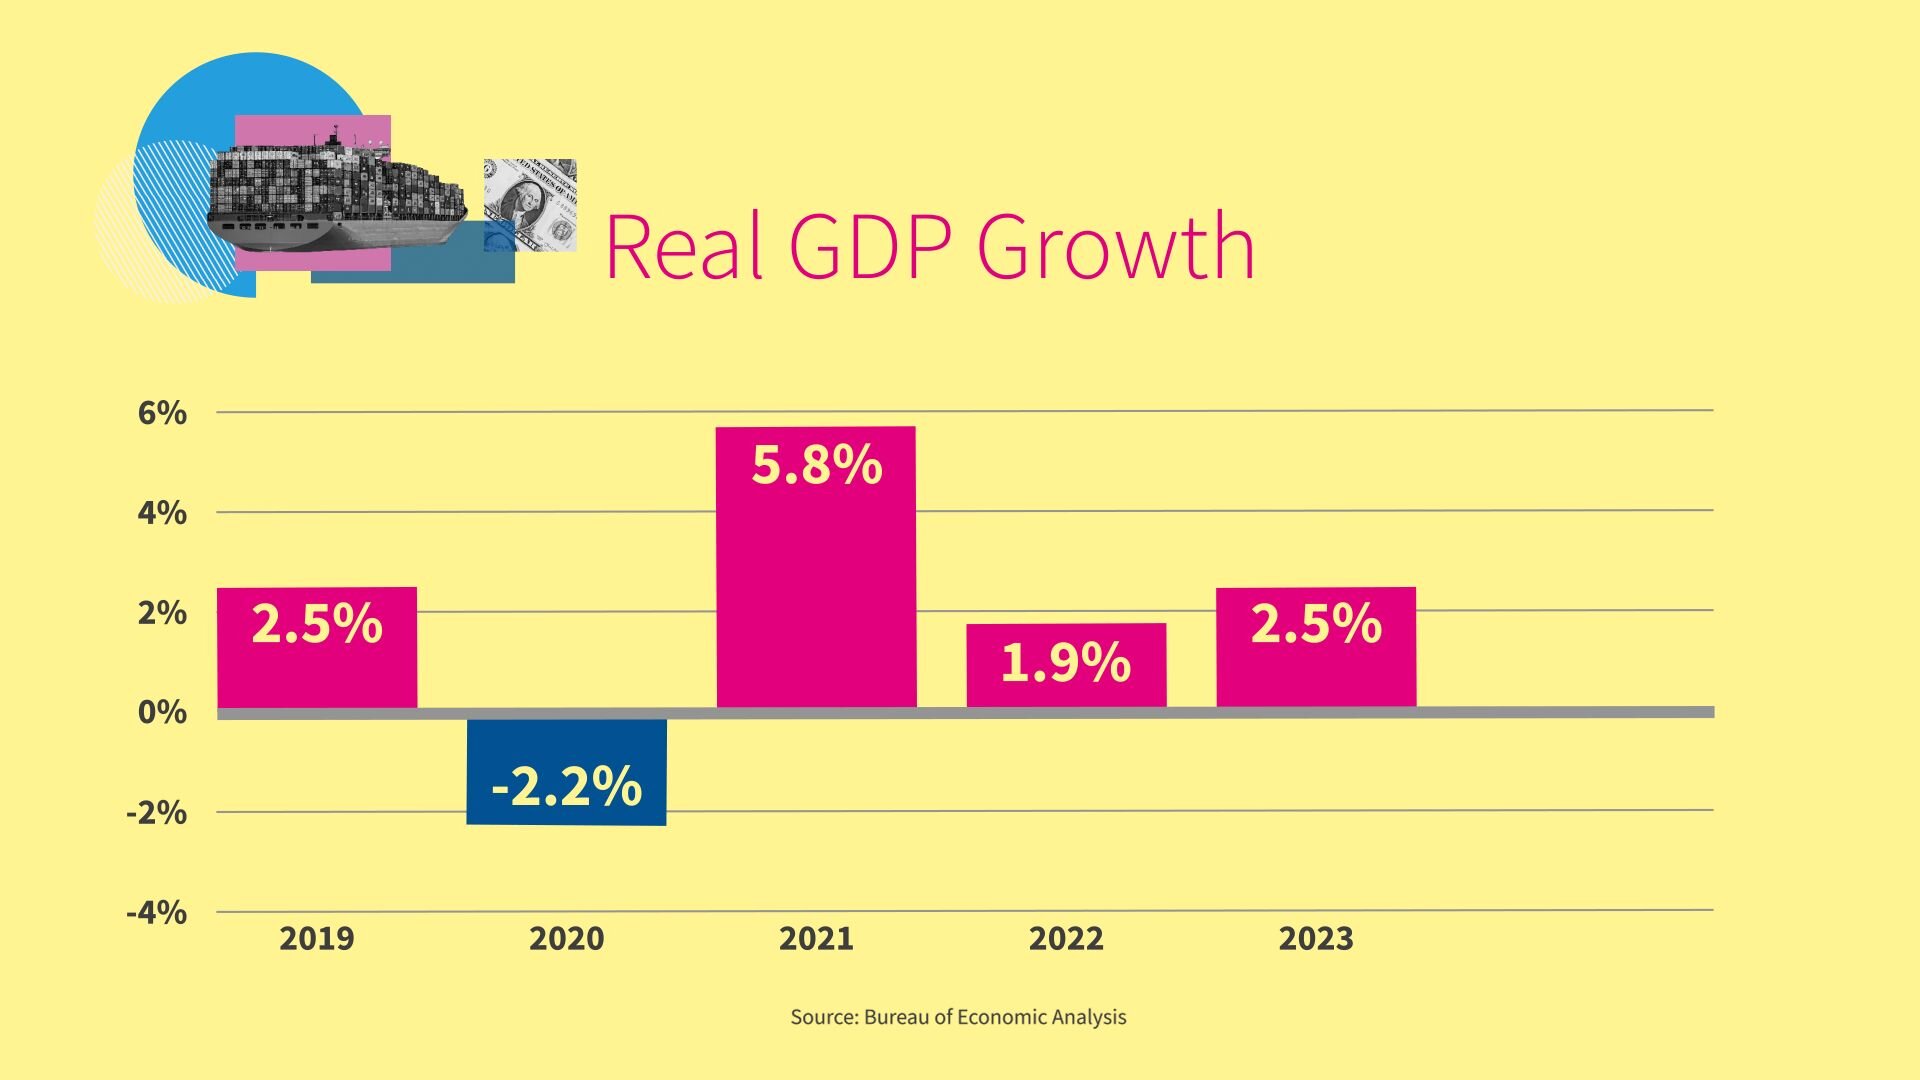
We went from 2.5% growth in 2019 to negative 2.2% in 2020 when COVID hit, to a surge of 5.8% in 2021, during the recovery, and now to about 2.5% in 2023.
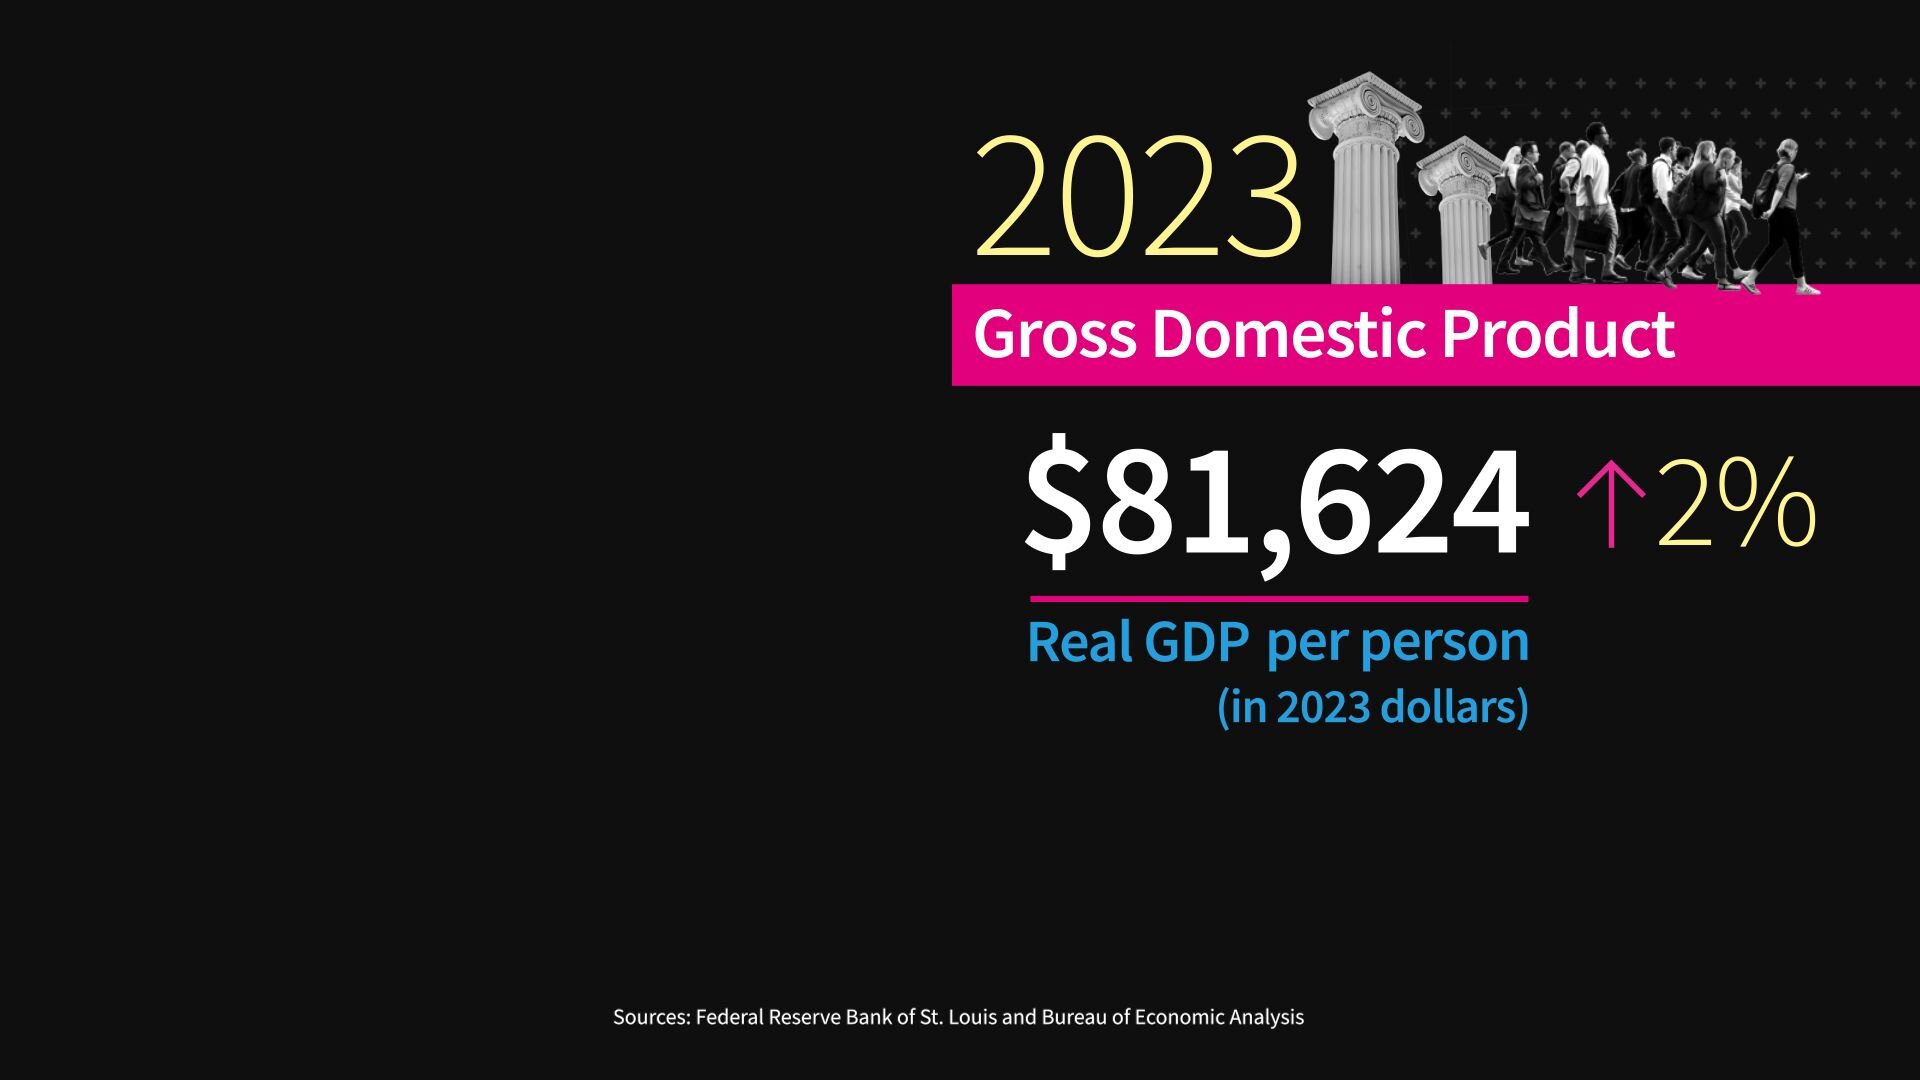
In 2023, real GDP per person in the United States reached a high of $81,624, which is up 2% from 2022.
While GDP is a pretty good way to measure how well the economy is doing for the US as a whole, it doesn't necessarily describe how the economy feels to the average American. For that, we need to look at statistics like jobs, wages and spending.
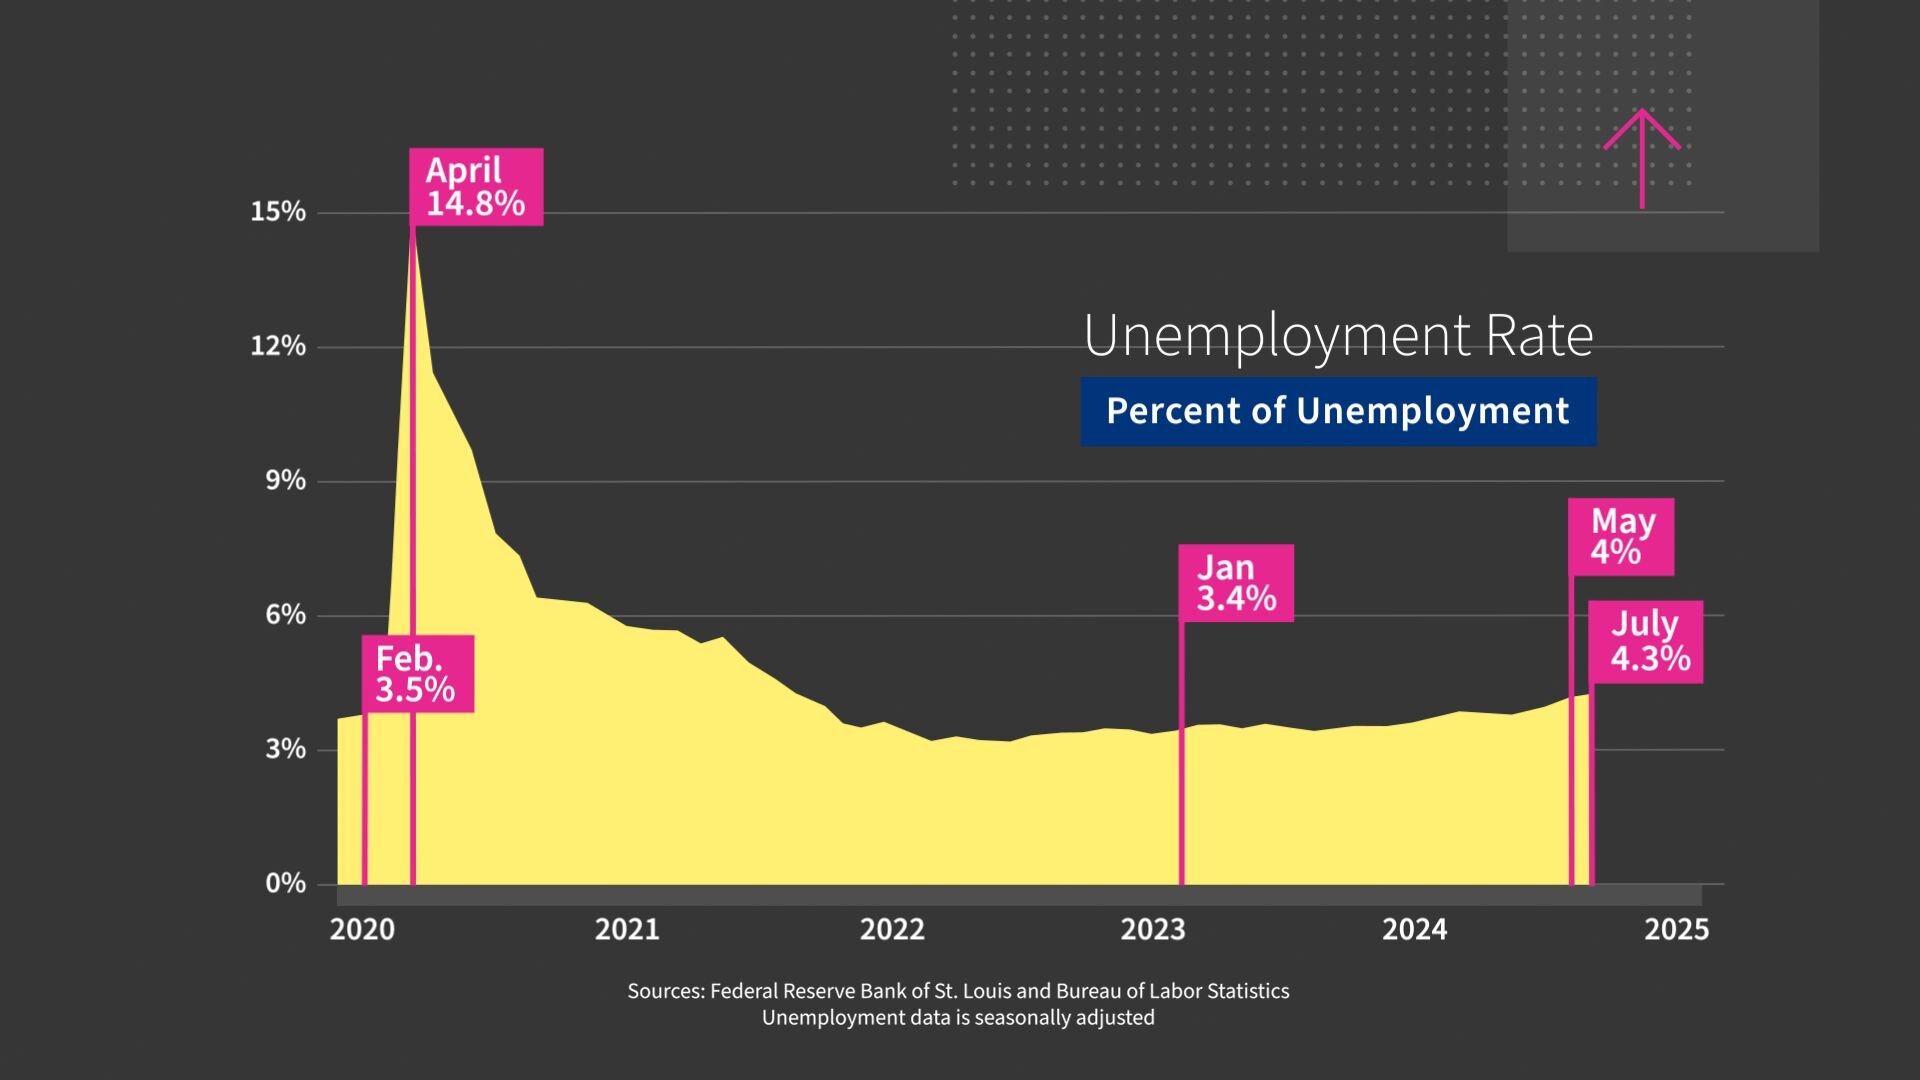
On jobs, let's start by looking at unemployment. In February of 2020, a month before the COVID outbreak, unemployment was a low 3.5%. But by April of 2020, about a month into the pandemic, the unemployment rate had already shot up to 14.8%. But in January of 2023, it hit 3.4%. As of May 2024, it sat at 4%.
So next up is inflation. We hear a lot about inflation, but what is it? In layman's terms, it's the rate at which the prices of things you buy increases.
To measure inflation, let's start by looking at the Consumer Price Index or CPI. A government official measurement of inflation that includes a representative basket of the goods and services that people buy.
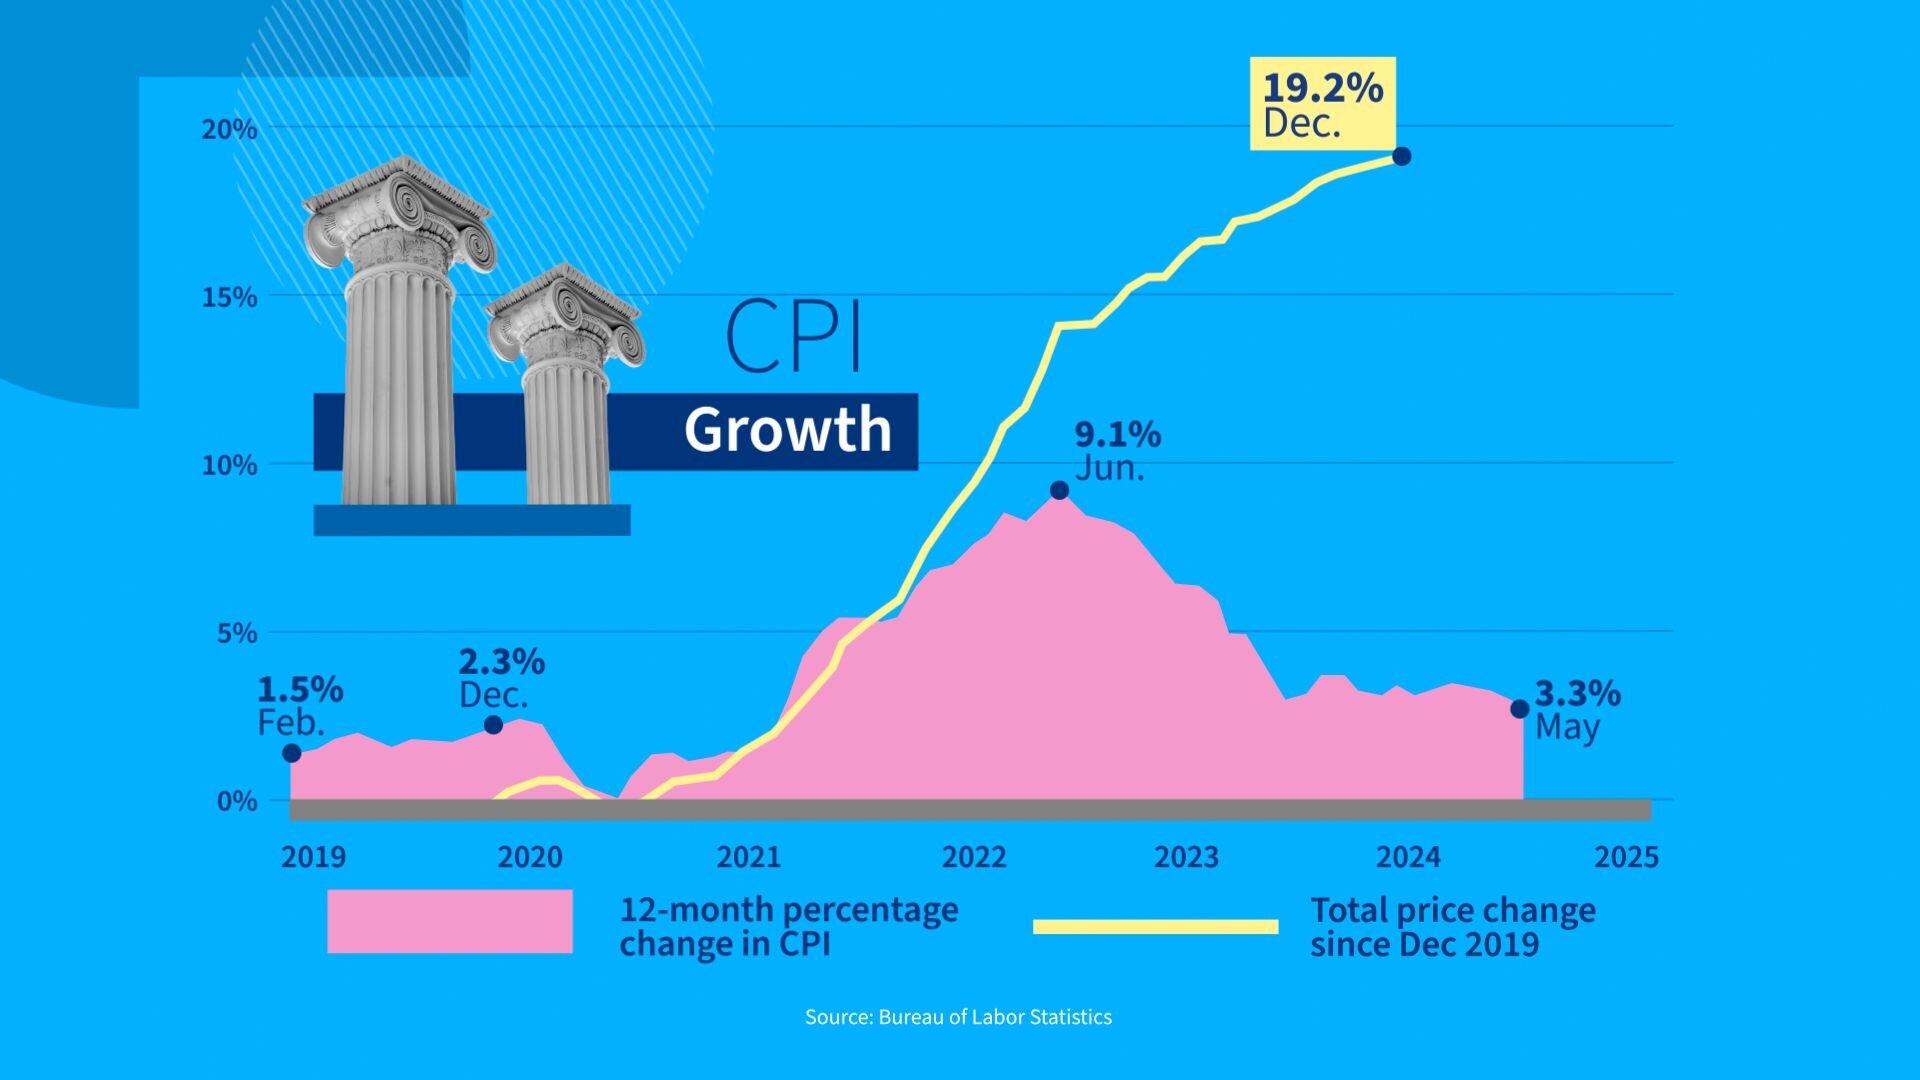
The CPI growth hovered monthly between 1.5% and 2.3% in 2019, the year before the pandemic. It skyrocketed to a high of 9% in June of 2022. As of May of 2024, it's down to 3.3%.
But even as the rate of inflation comes down, it does not erase the impact of accelerated price increases over time. The cumulative increase in the cost of goods and services before the pandemic, about 19%.
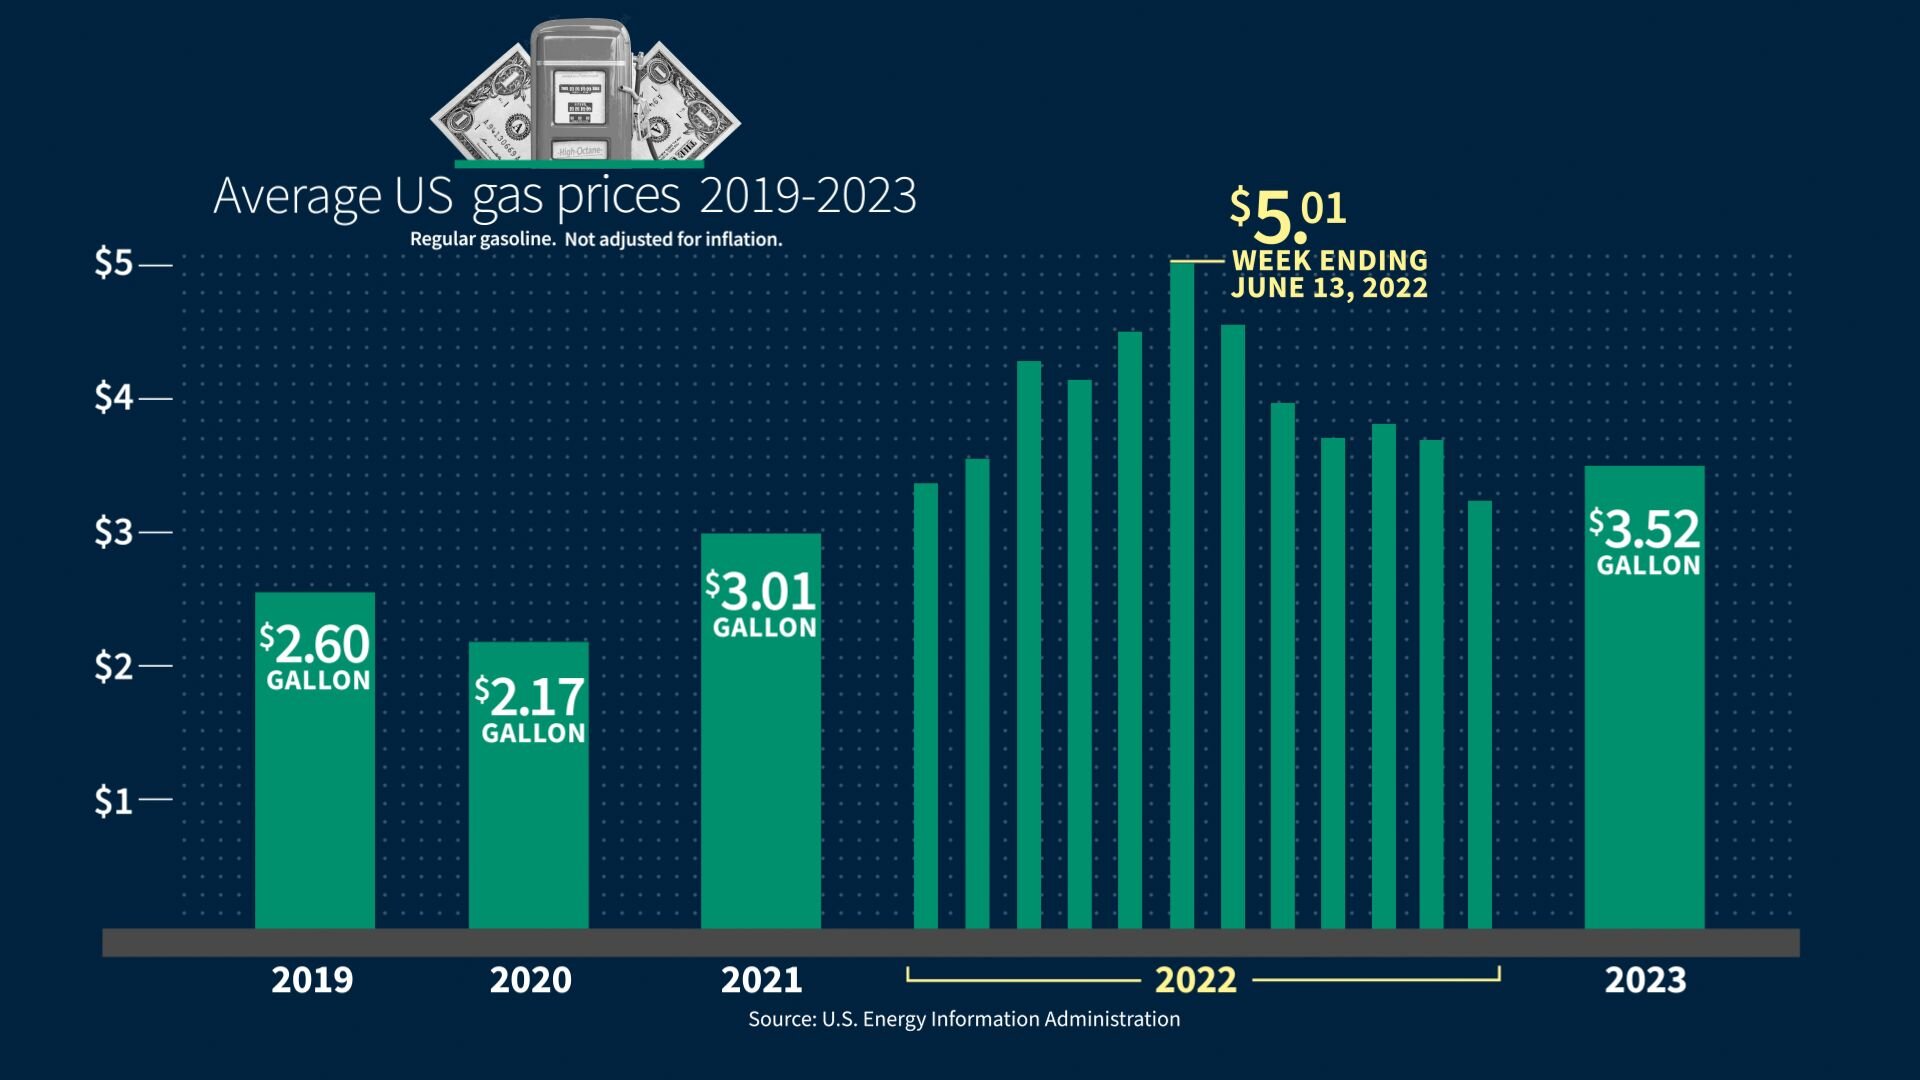
In 2019, the average cost of a gallon of gas was $2.60. By 2022, the average was nearly $4. And in the month of June, it was nearly $5 a gallon. In 2023, the average cost lowered somewhat to $3.52 a gallon.
Let's zoom in on two other costs people frequently focus on: housing and food.
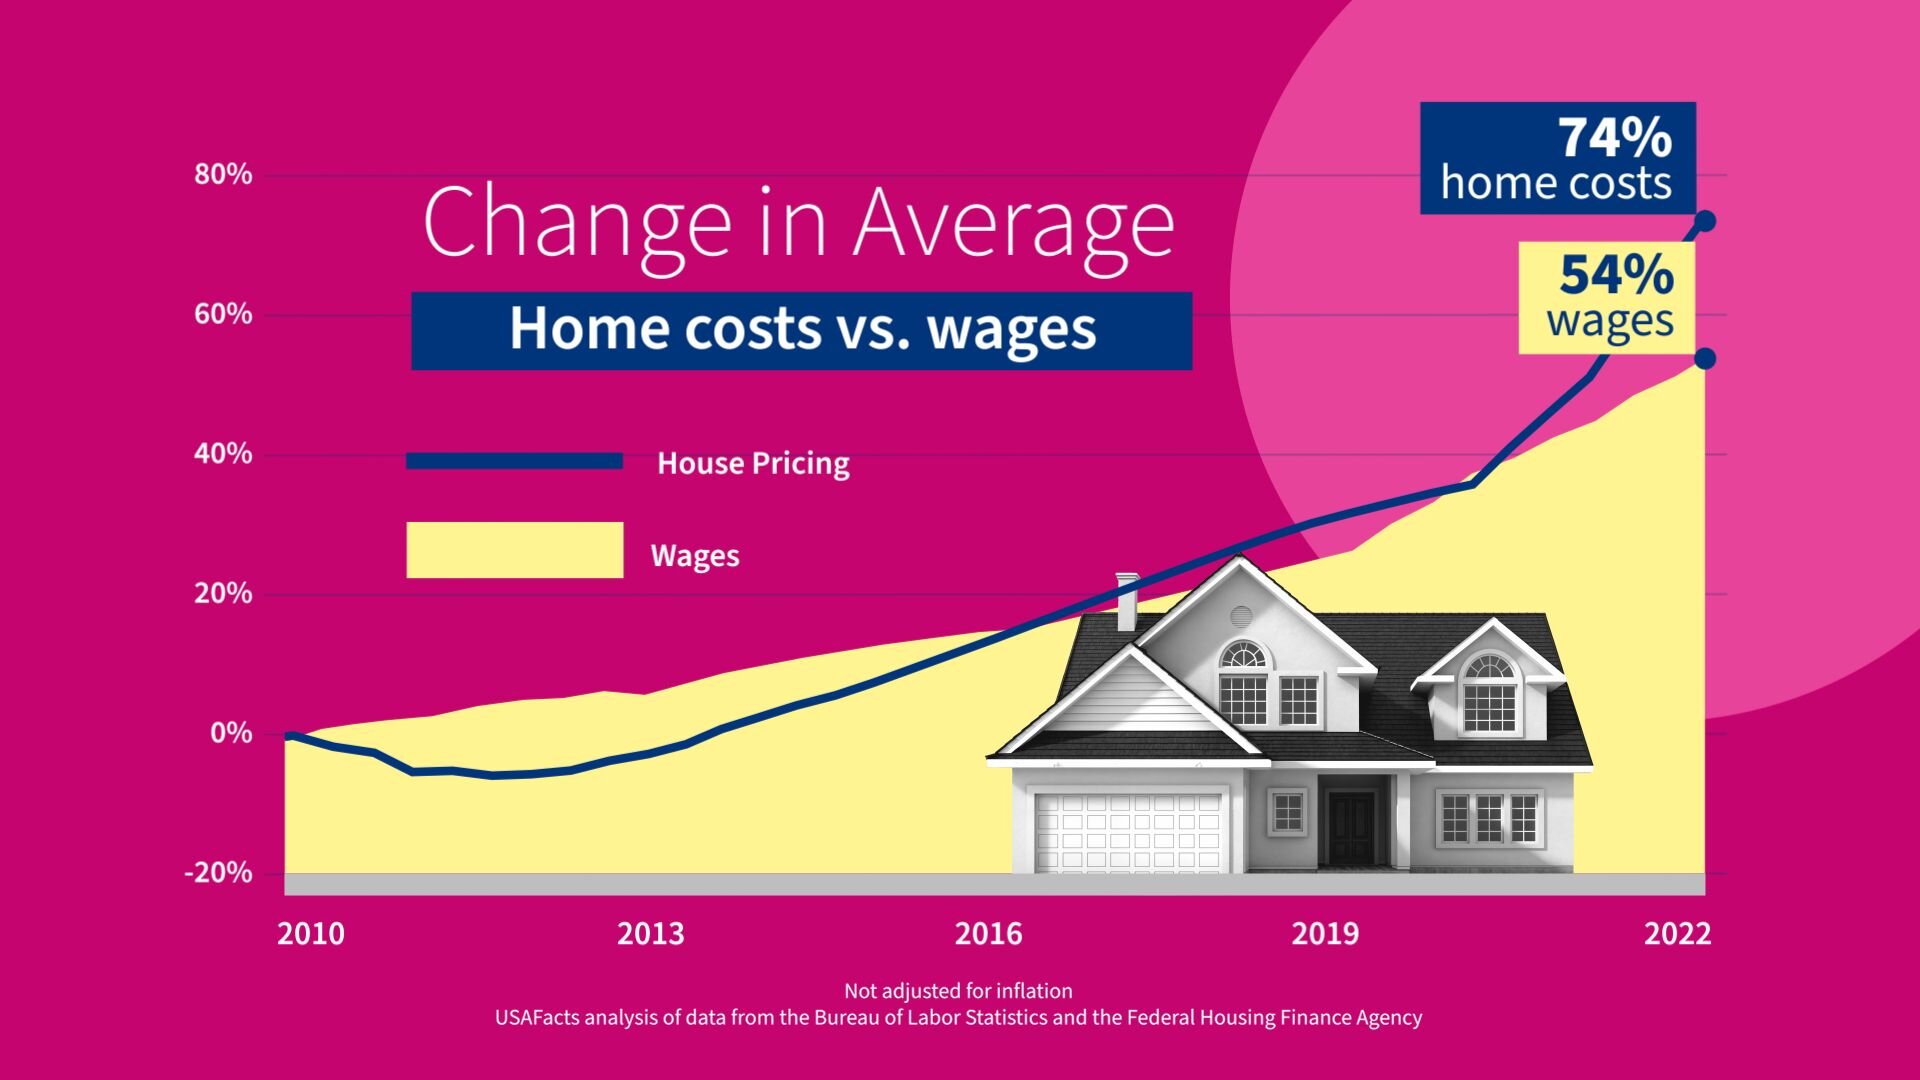
Overall, the cost of housing, rental price and the owner's equivalent of rent has increased 21% since January of 2021. If we take a longer term perspective, cost of homes has outpaced wage growth with home costs up 74% and wages up 54% between 2010 and 2022.
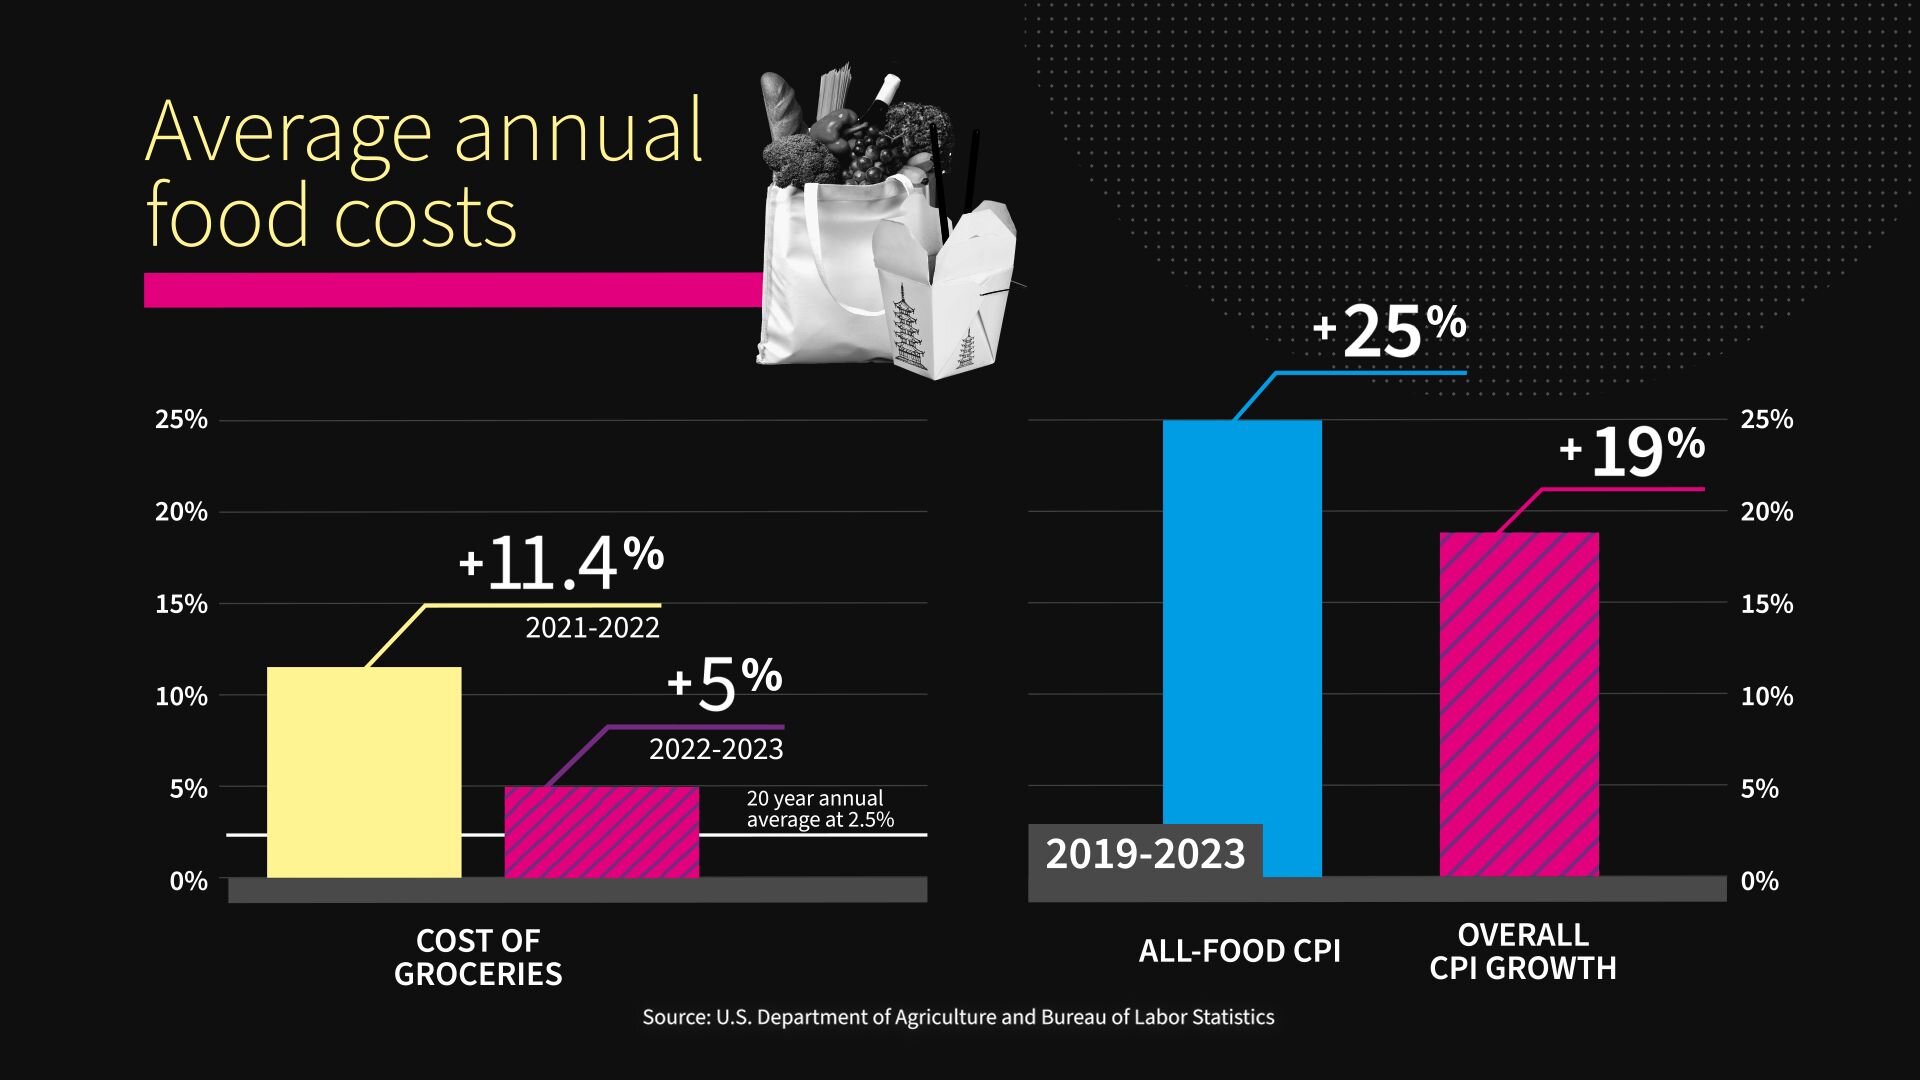
Let's look at food, specifically the cost of groceries. Between 2021 and 2022, average annual grocery prices were up 11.4%, the highest increase since 1979. And they grew another 5% between 2022 and 2023. From 2019 to 2023, the cost of groceries and eating out rose by 25%, compared to 19% for the overall CPI growth.
Now, I want to step back with a little sidebar. To combat inflation, we have empowered the Federal Reserve; they apply the brakes by raising interest rates.
That's what they have done for the last two years, once inflation started really heating up.
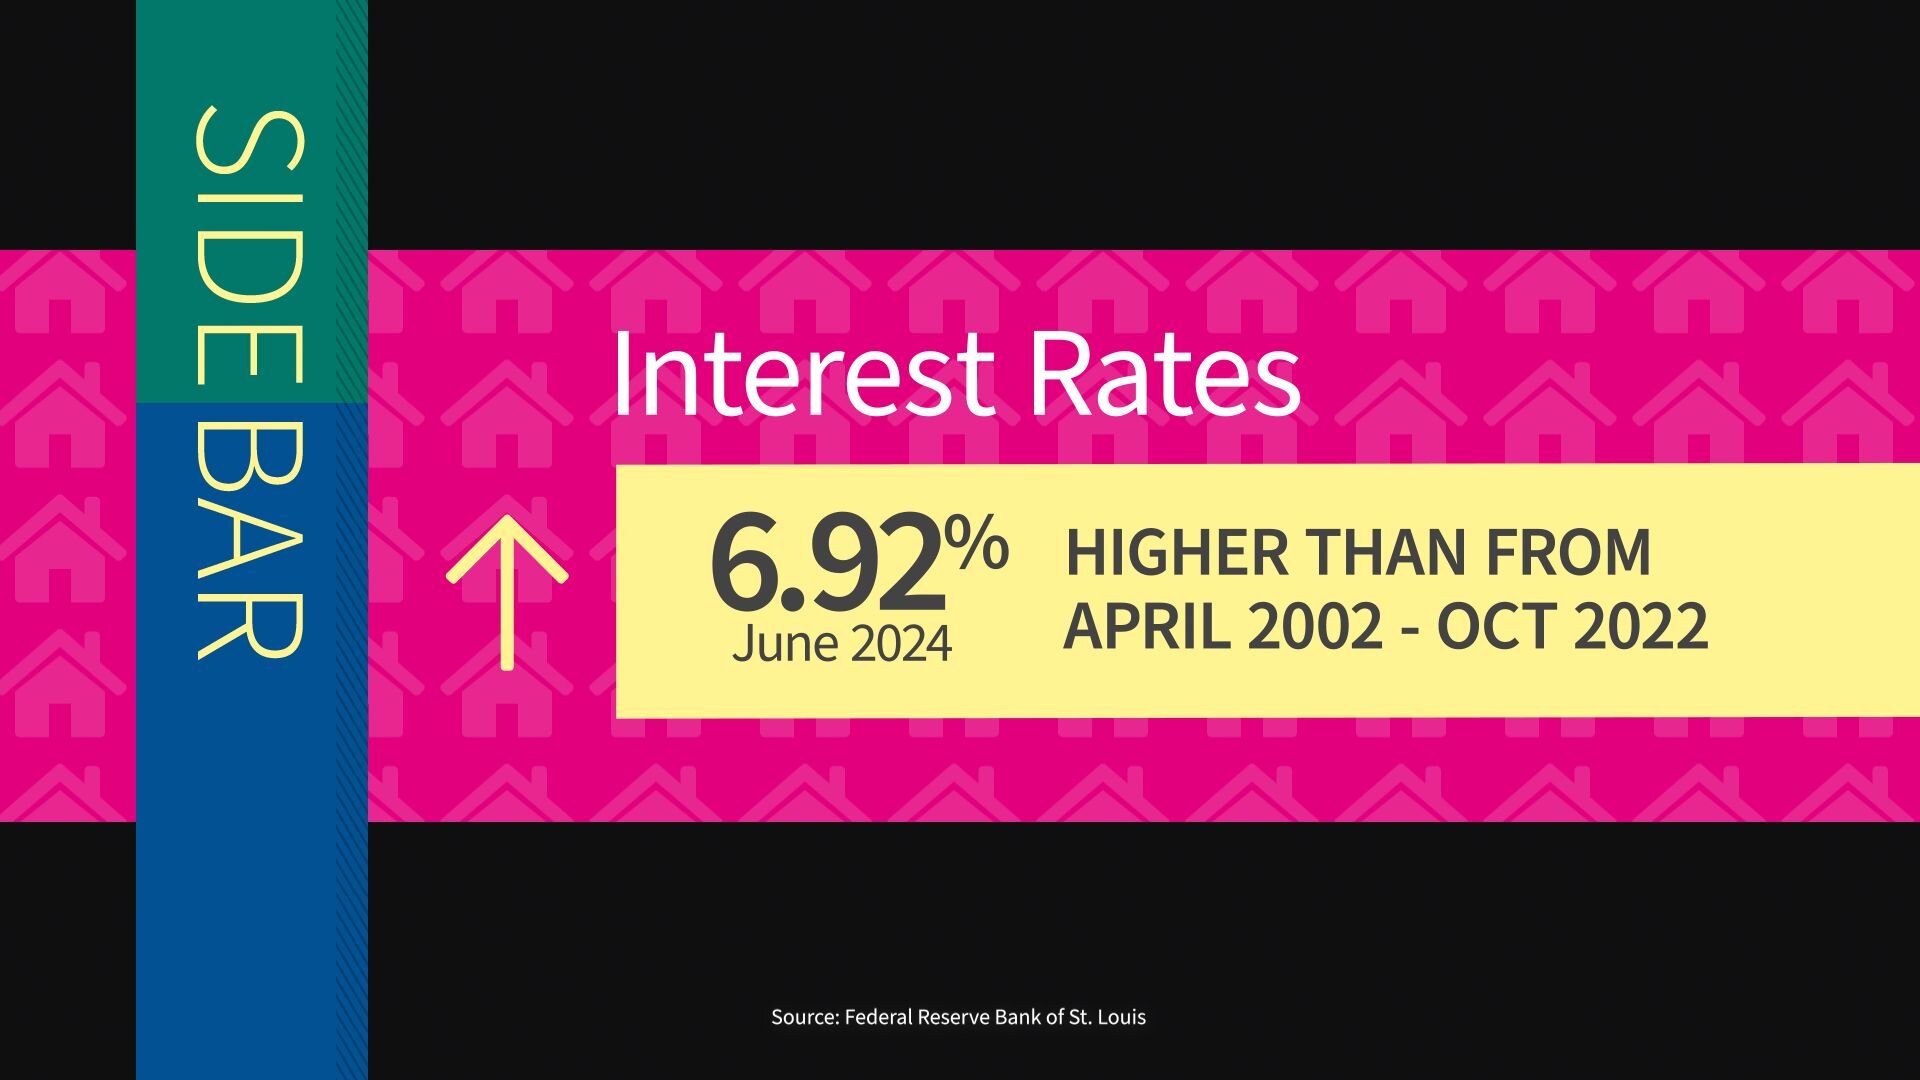
That sent the interest rates for getting a mortgage up from under 3% a year to 7% for most people, and that's higher than any point between April of 2002 and October of 2022.
Let's do a fact check. Real GDP per capita: all time high in 2023 of nearly $82,000. Unemployment down to 4%. Inflation rate: down close to 3%. But key expenses like energy, food and housing are more than 20% more expensive than they were at the start of 2021.
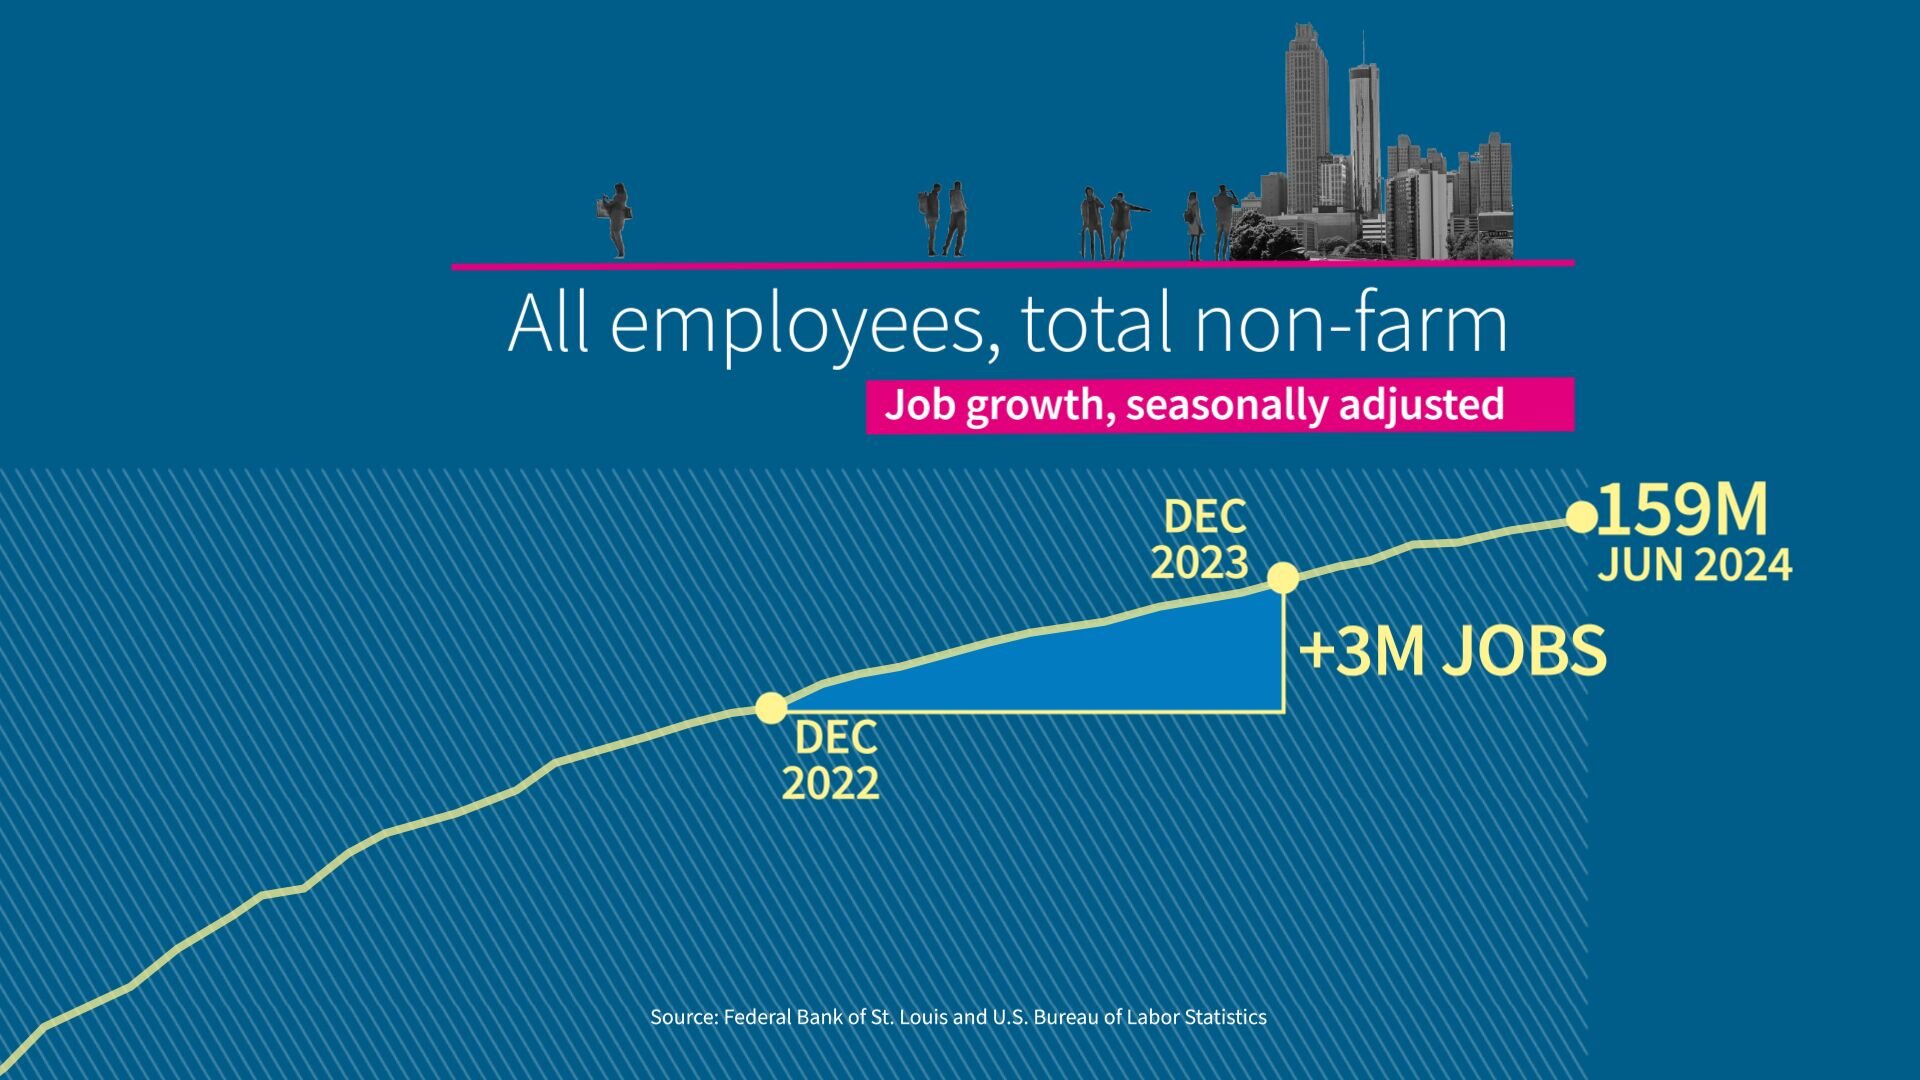
Okay. So, let's now talk about how folks are doing. US employers added about 3 million jobs in 2023. That grew our workforce to 159 million people.
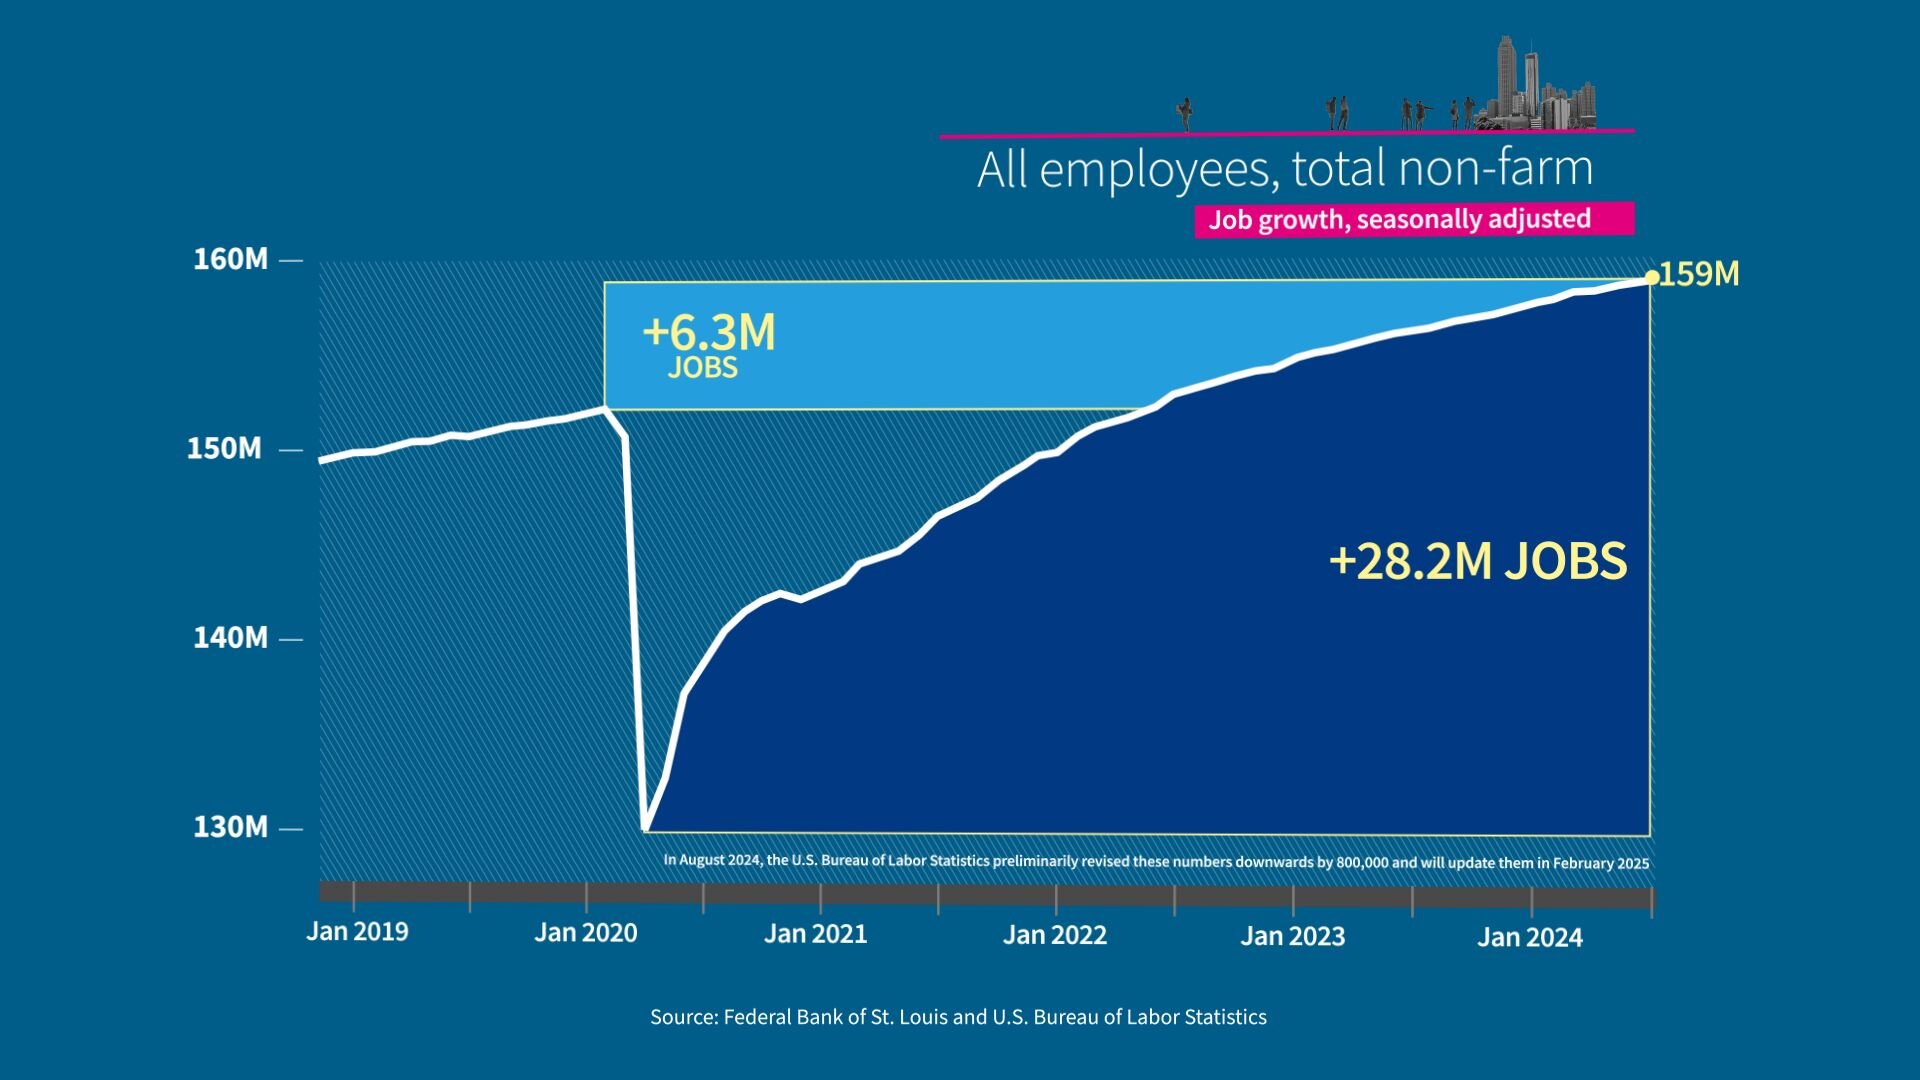
During the pandemic, we first lost jobs and then we gained jobs back. 28 million since the low in employment in April of 2020. There's been a gain of 6 million jobs total since right before the pandemic.
Now, let's look at the bottom line. Are Americans getting ahead or falling behind?
The median wage, which includes salary, base wages, commission, tips, the income you earn from working, has increased by nearly $8,250 since before the pandemic in 2019. It moved from $39,810 in 2019 to $48,060 in 2023.
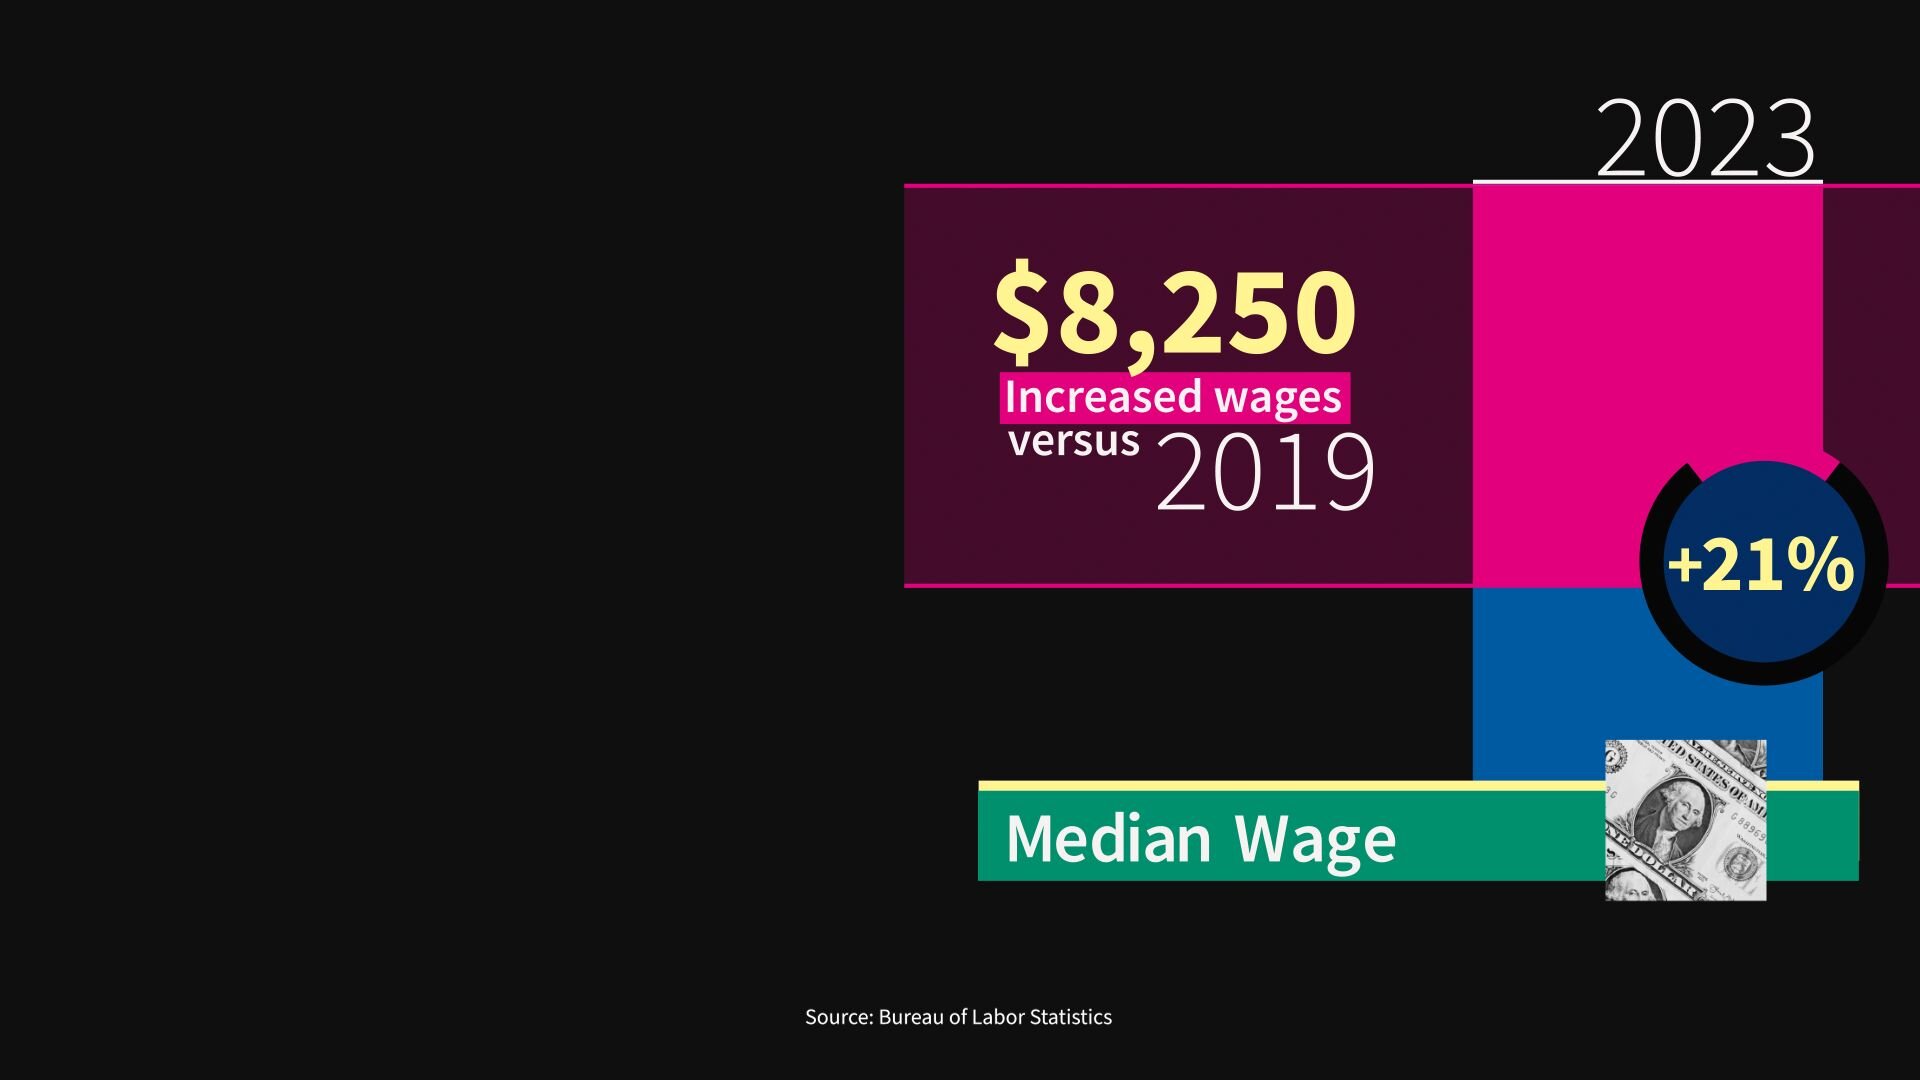
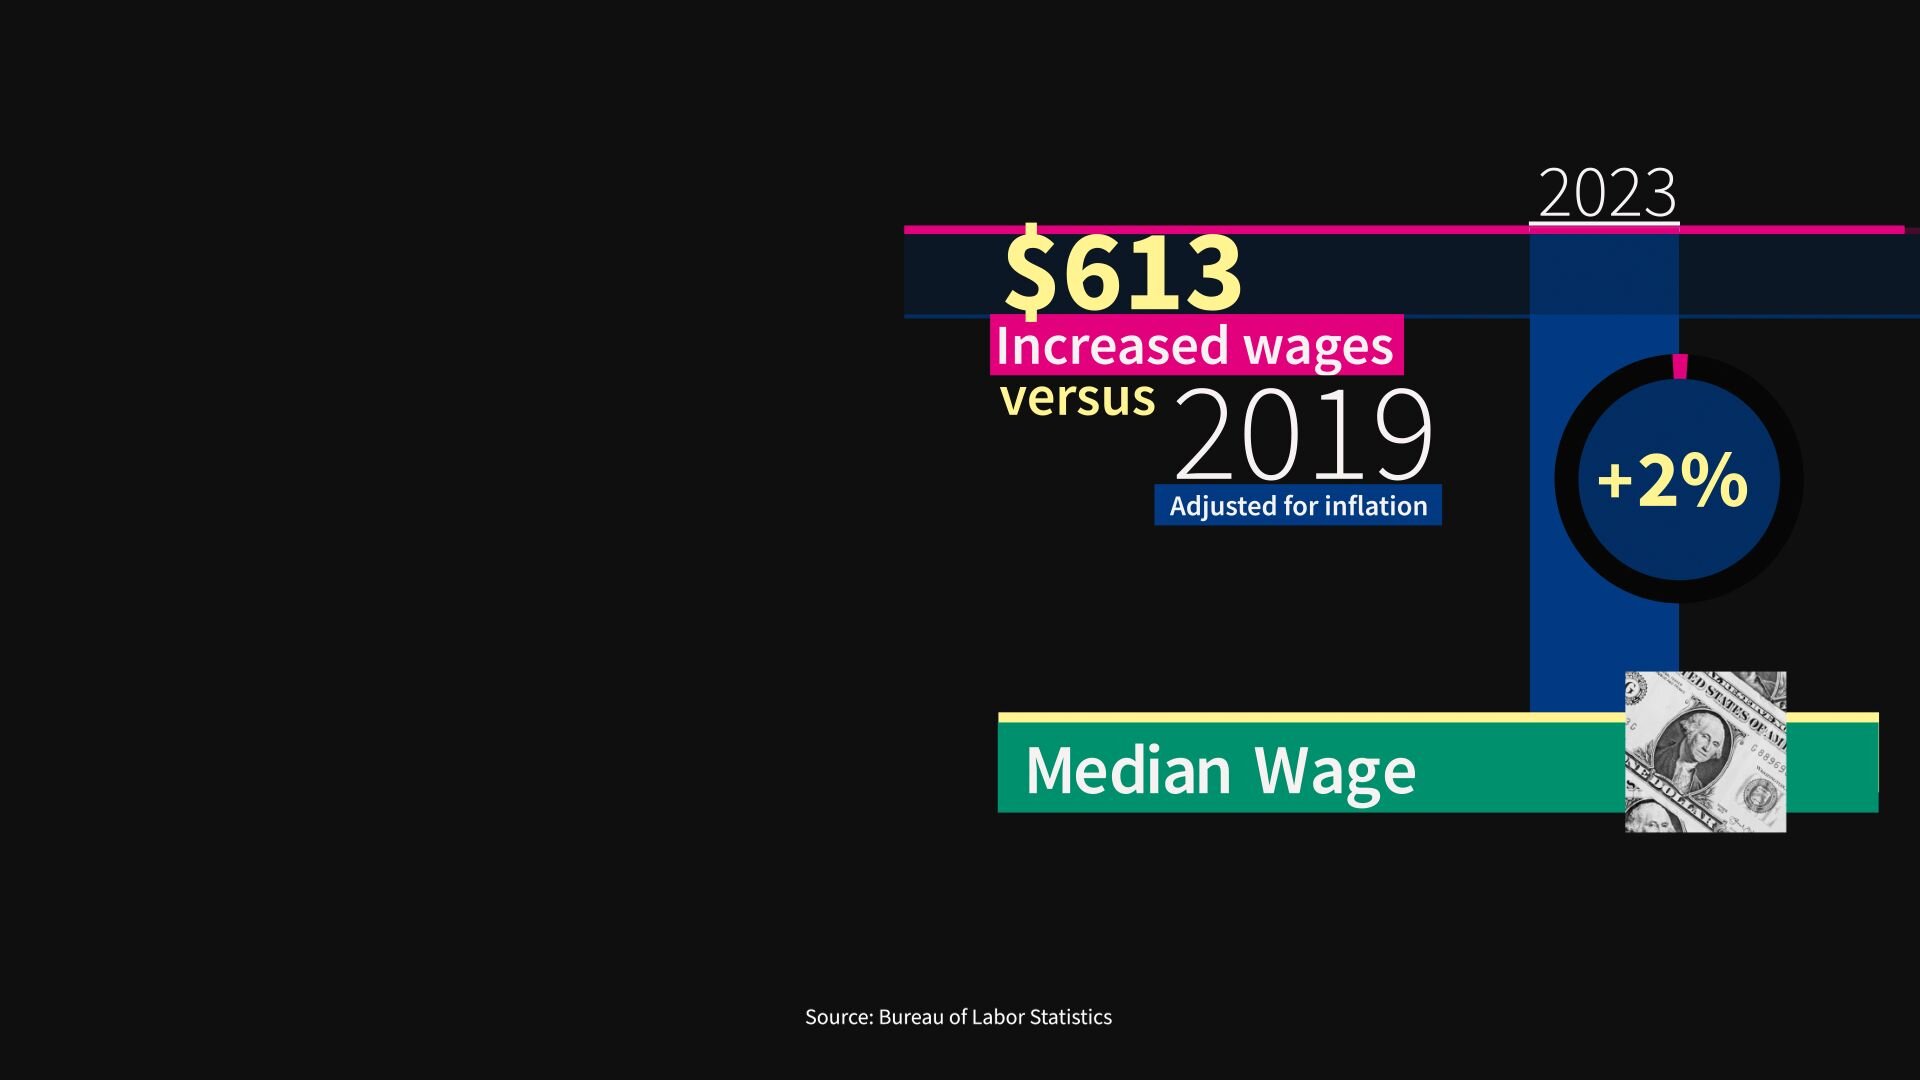
That seems pretty good. But once you take inflation into account, that $8,250 increase quickly shrinks to a little bit more than $613 in wage increases in four years, a 2% increase.
To really get a picture of what folks have to live on, we will look at three factors: income, how much you have to pay in taxes, and what you receive in government benefits.
There's market income. The money a family makes from wages and investments in individual retirement accounts, as well as the health care that's paid for by your employer. Then subtract taxes: federal, state and local. Add to that government benefits like social security, food stamps, refundable tax credits and even services like Medicaid and Medicare.
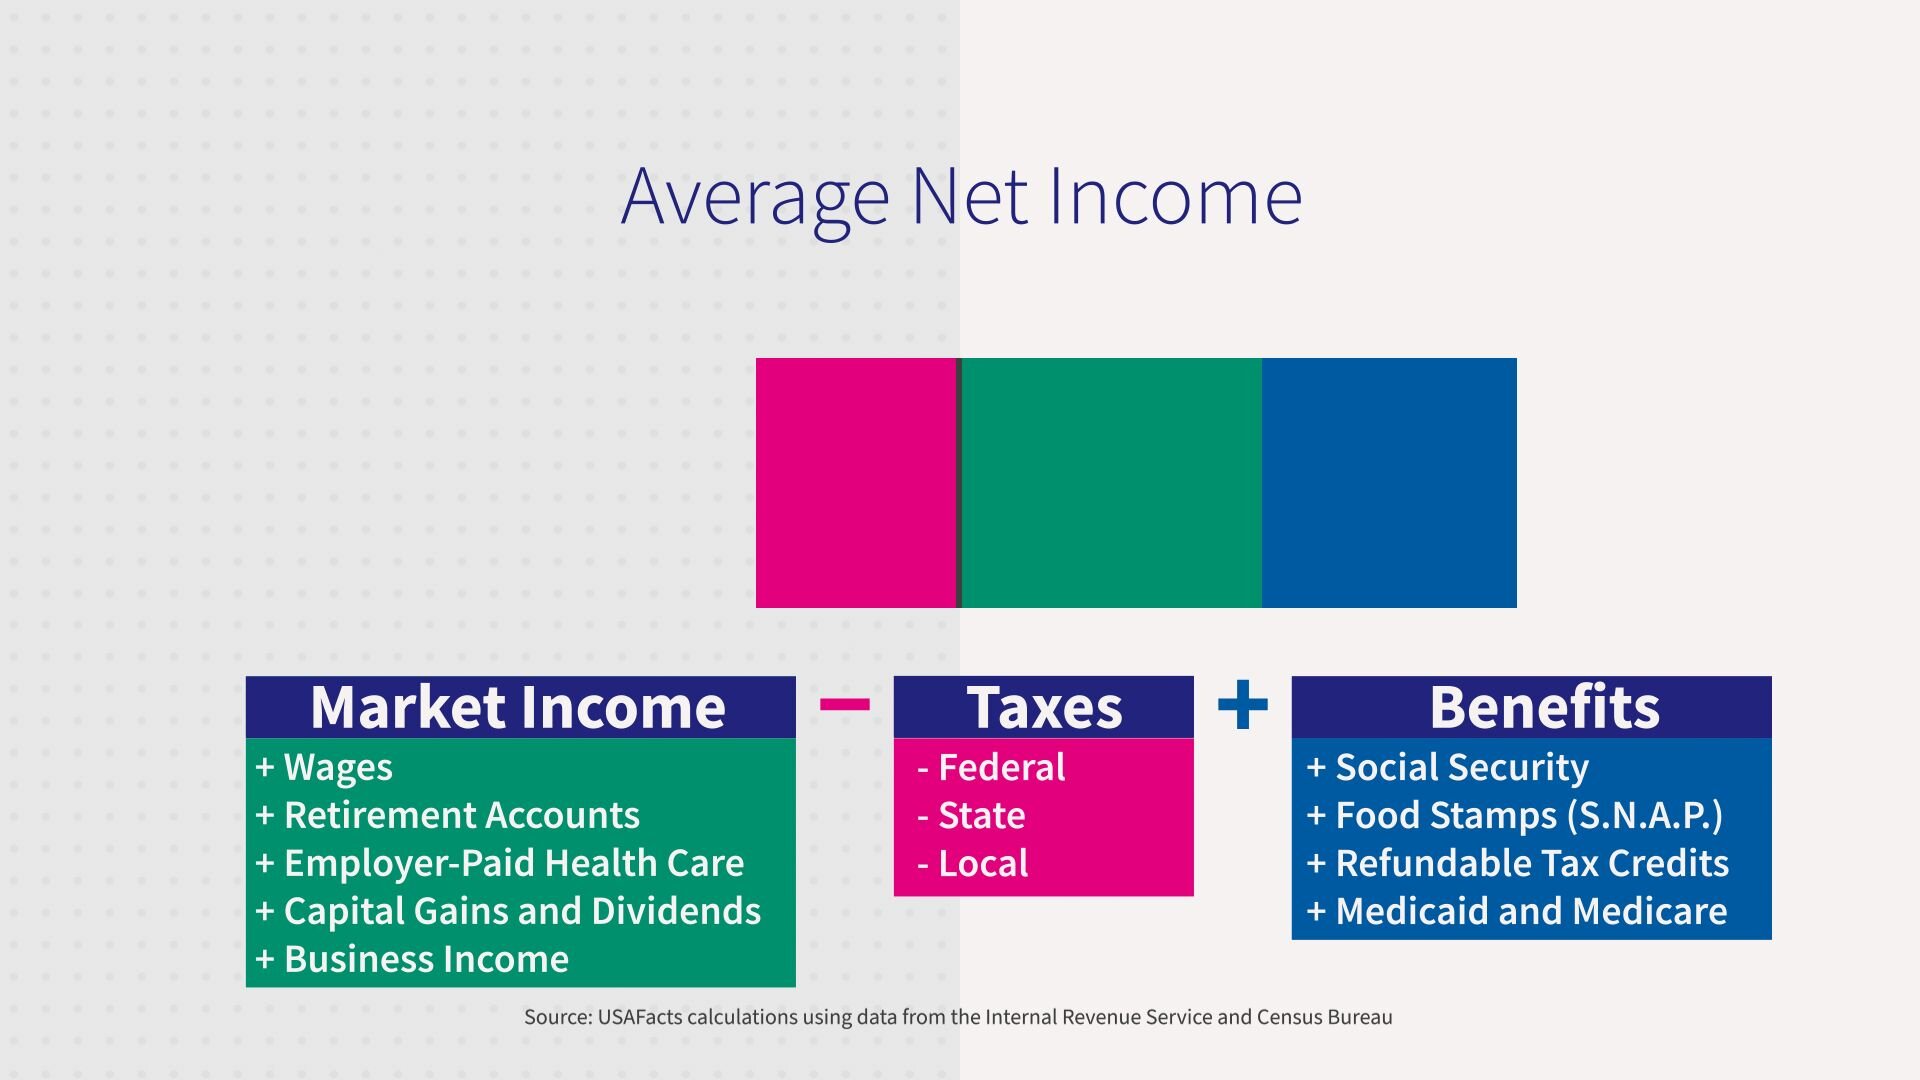
Let's do the math. I want to divide the population into 20% chunks.
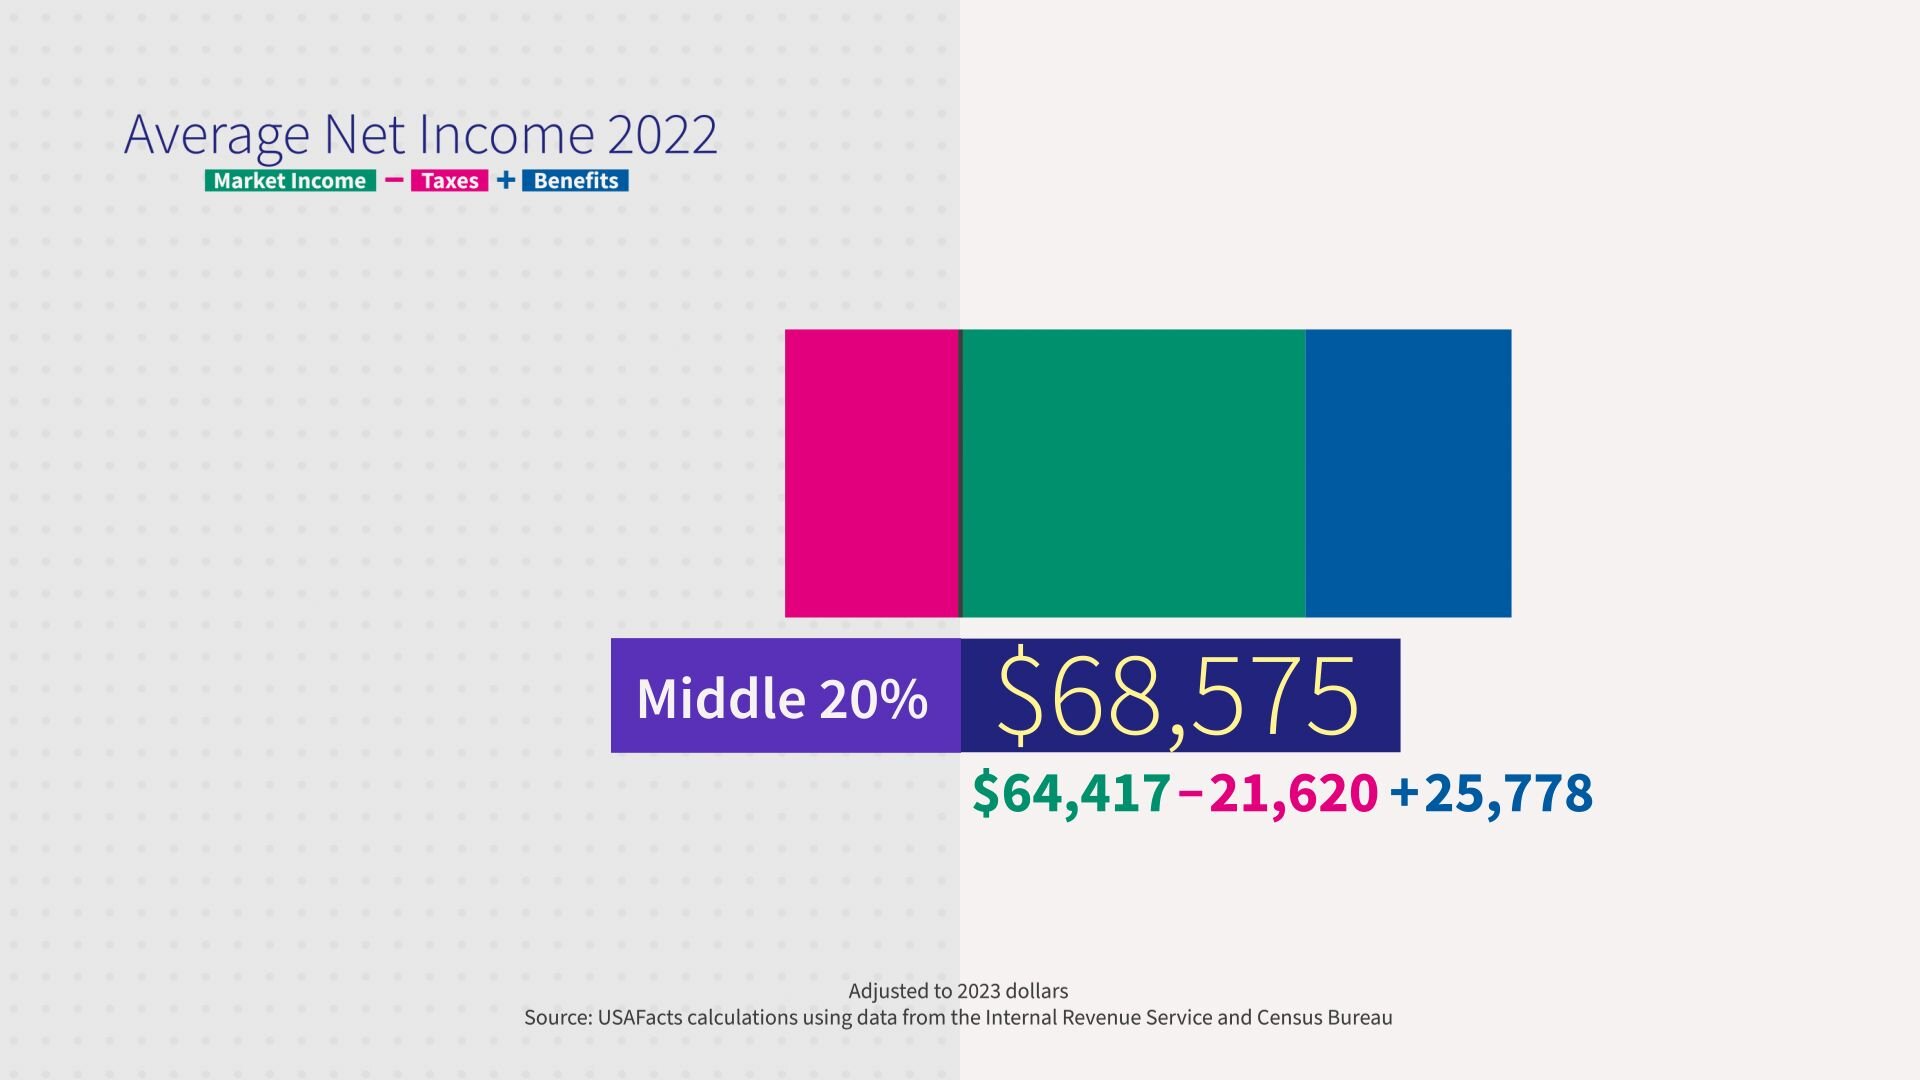
And let's start by looking at the 20% of American families that are in the middle. They have an average market income of $64,417. Then subtract their average taxes of $21,620. And add back in an average of $25,778 of government benefits.
So, the 20% in the middle ended up with an average of $68,575 to support their life.
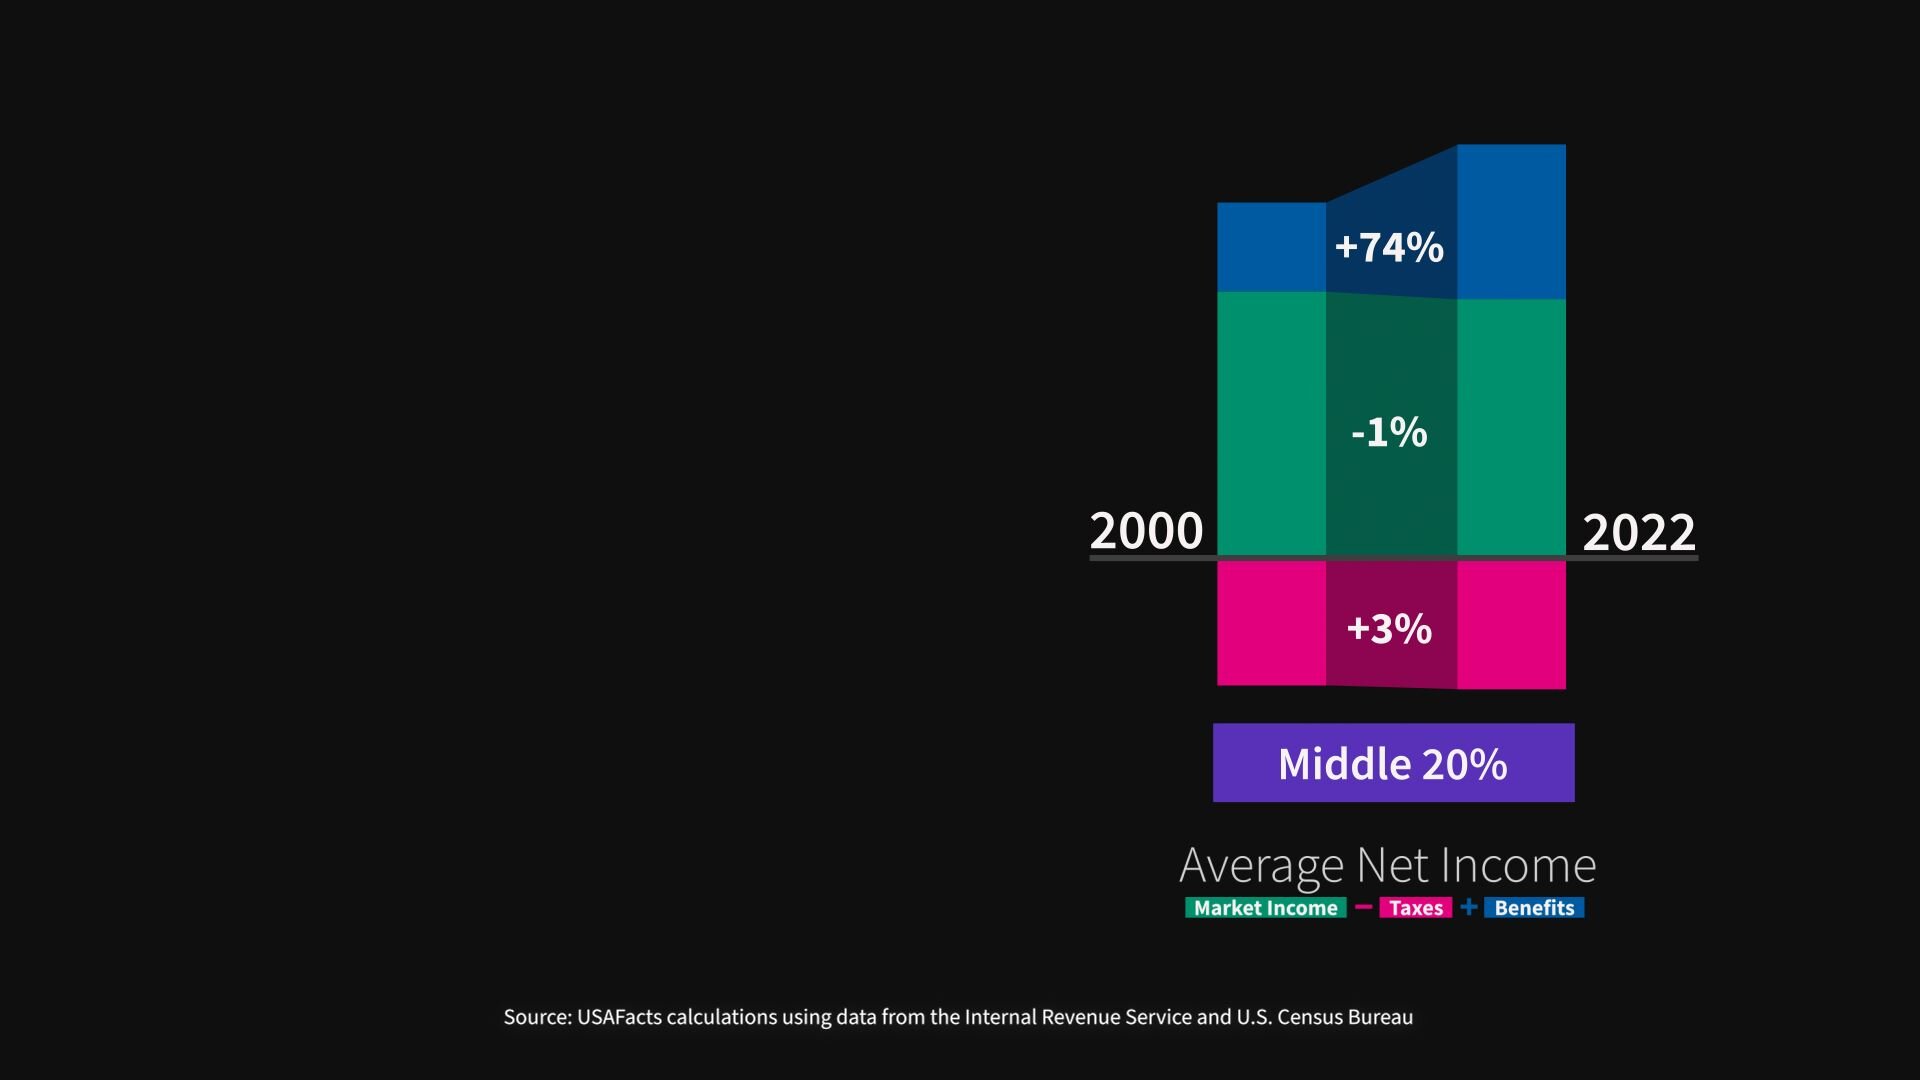
So how has this picture changed? Compared to 2000, it's a decrease of 1% in market income, an increase of 3% in taxes. Remember, income, property sales, Social Security and the like. And a much larger increase of 74% in government benefits. This is all adjusted for inflation.
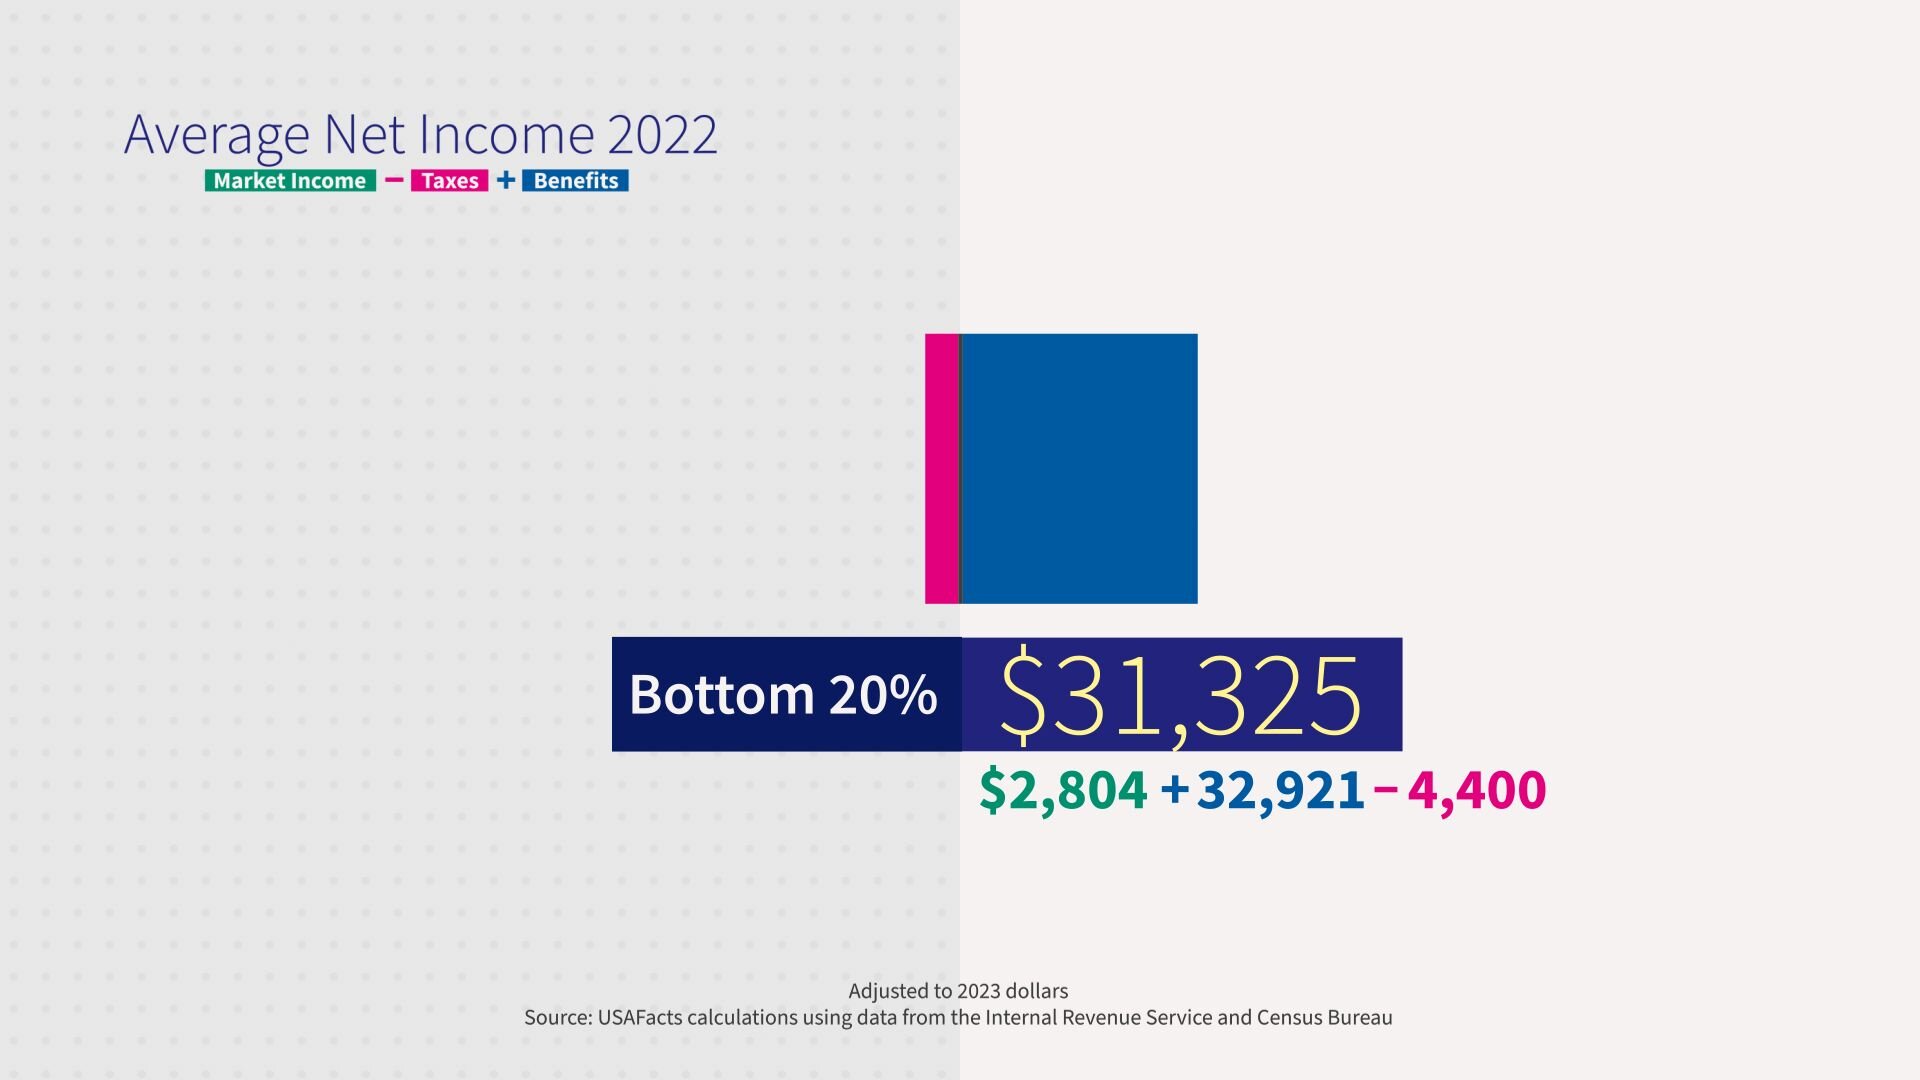
The bottom 20% had an average income of $2,800 in 2022 and received $33,000 in government benefits and paid an average of $4,400 in taxes. That ends up with $31,400.
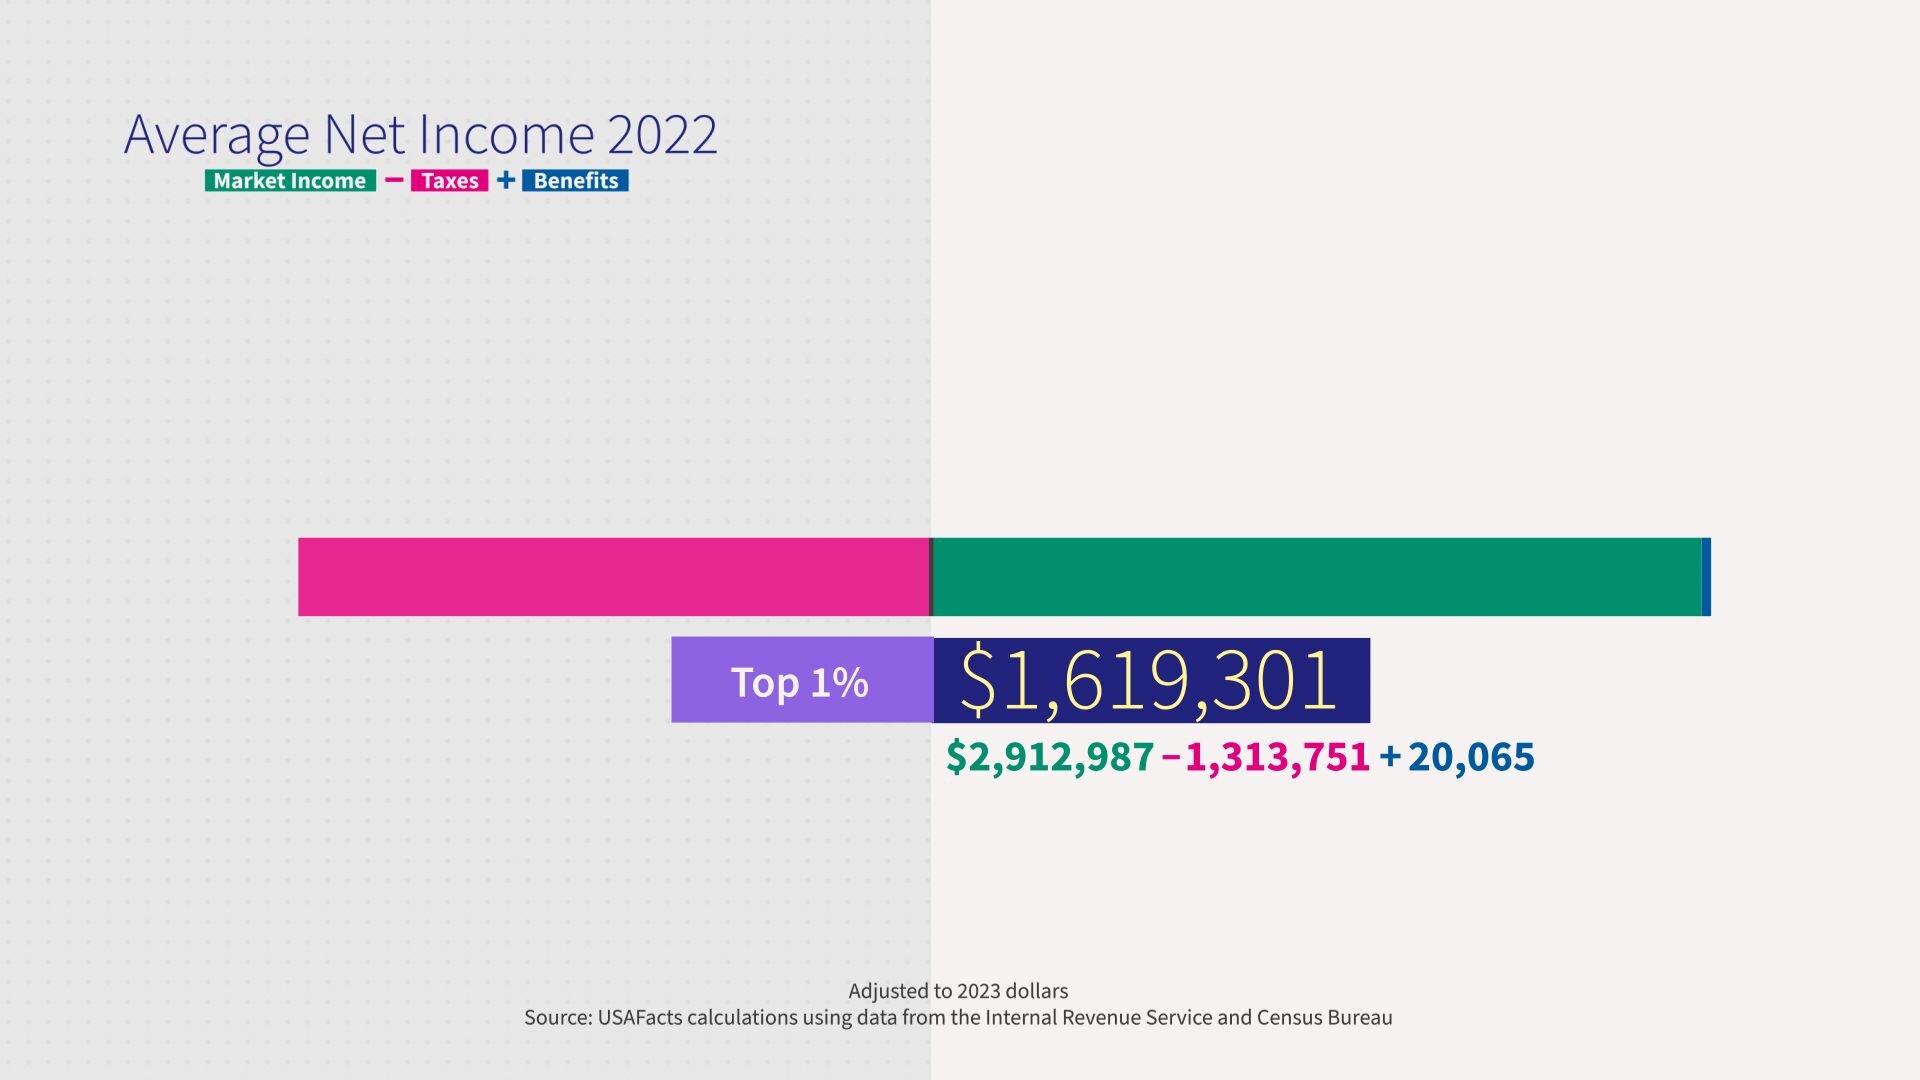
How about the top 1% of Americans? They made a minimum of $941,776. The average for this group is 2.9 million of income, minus an average of 1.3 million in taxes, plus an average of $20,000 in government benefits. This group ended up with a little bit over $1.6 million after taxes and benefits.
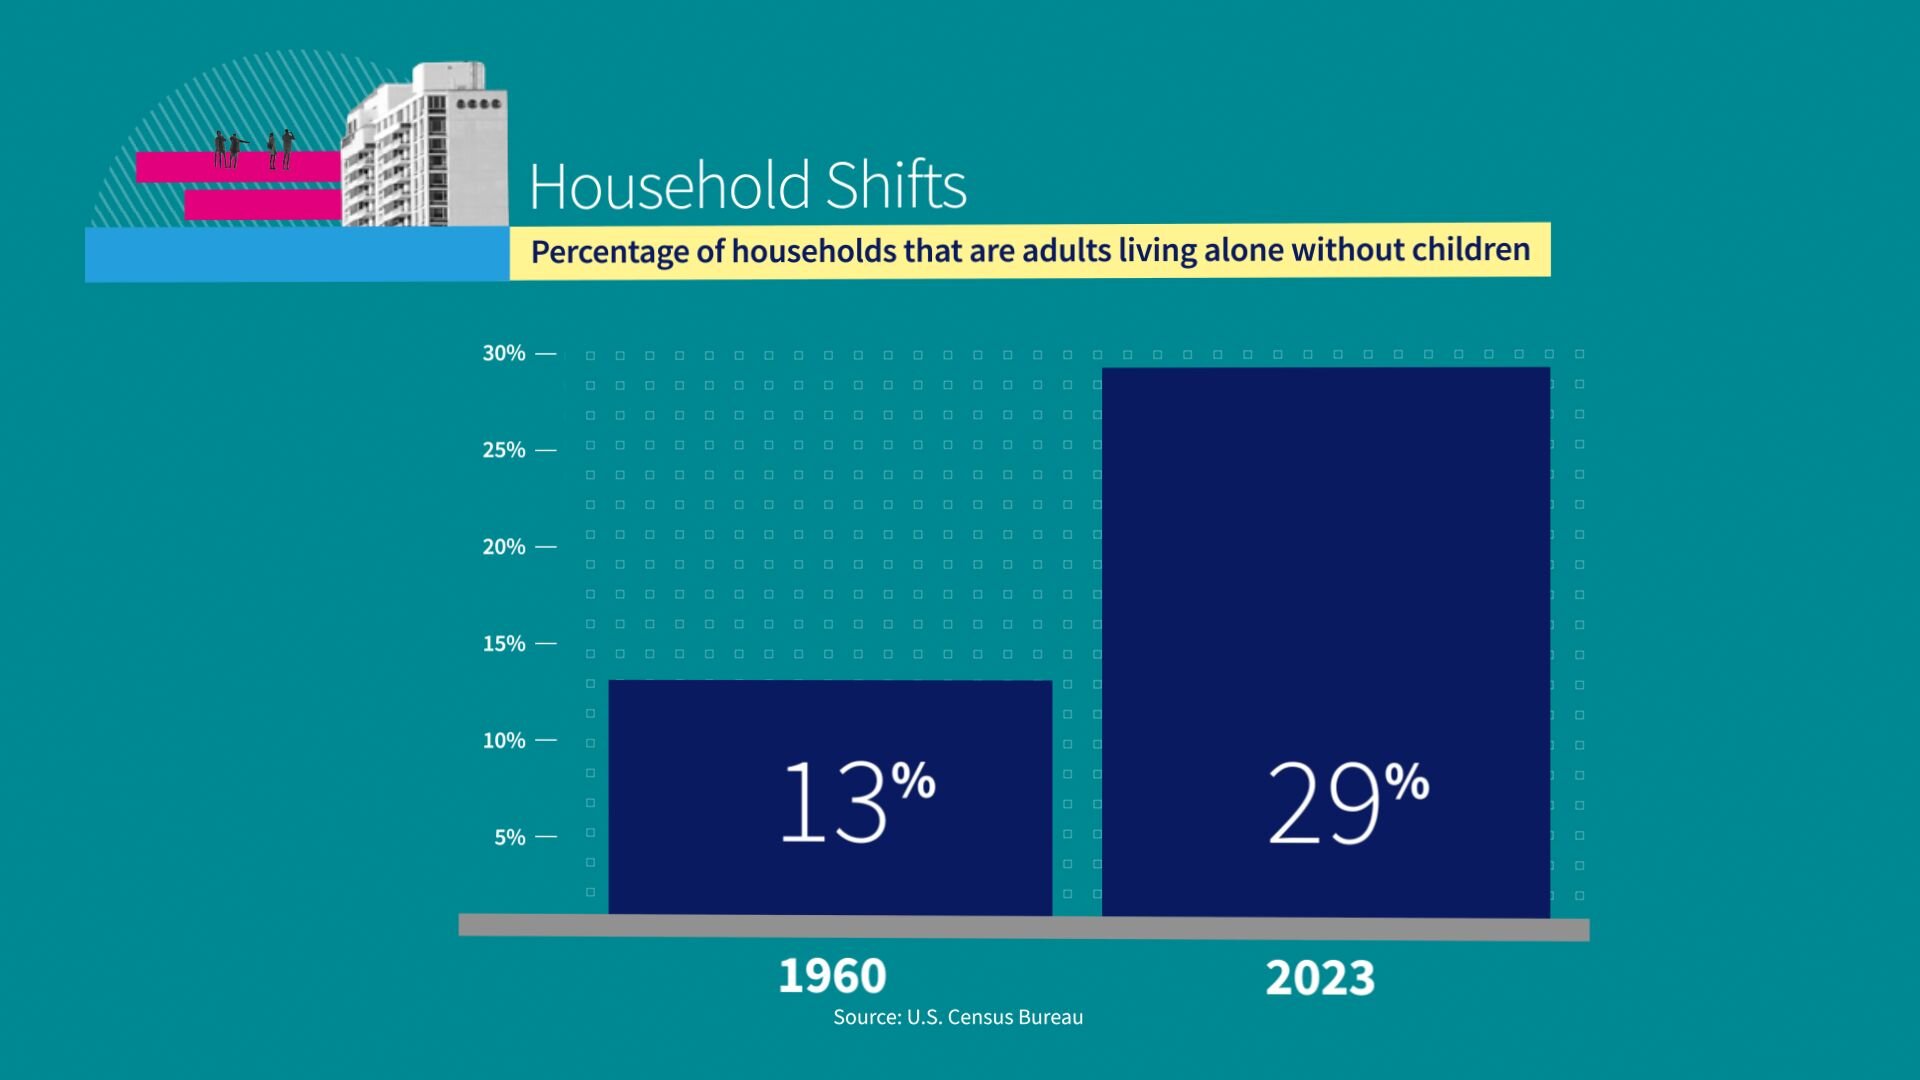
Family incomes are also lowered by two demographic shifts. First, people are more likely to live alone today than any time in the past. 29% of households today consist of individuals living alone without a child, compared to 13% in 1960.
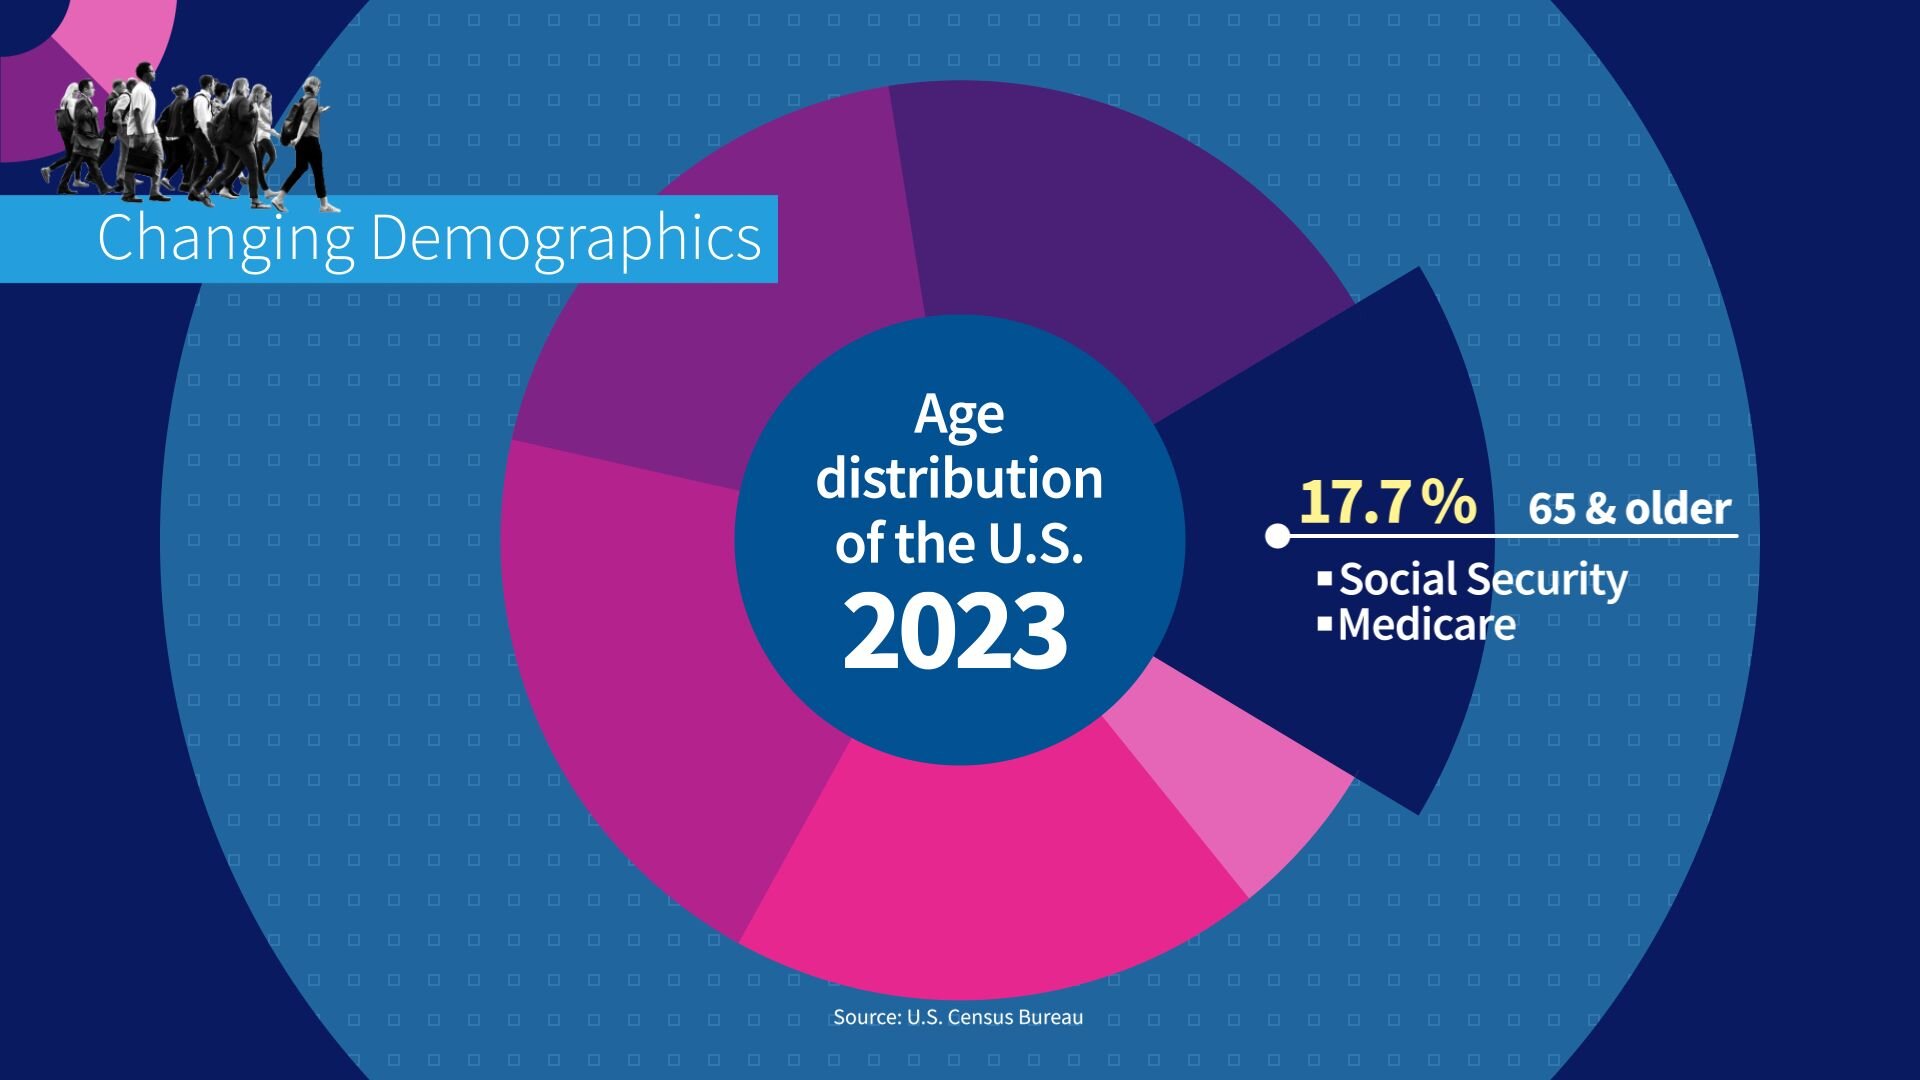
Second, a greater share of the population is over 65. Increasing from 13% of the total in 2010 to nearly 18% in 2023. More retirees rely on income from Social Security and support from government services like Medicare.
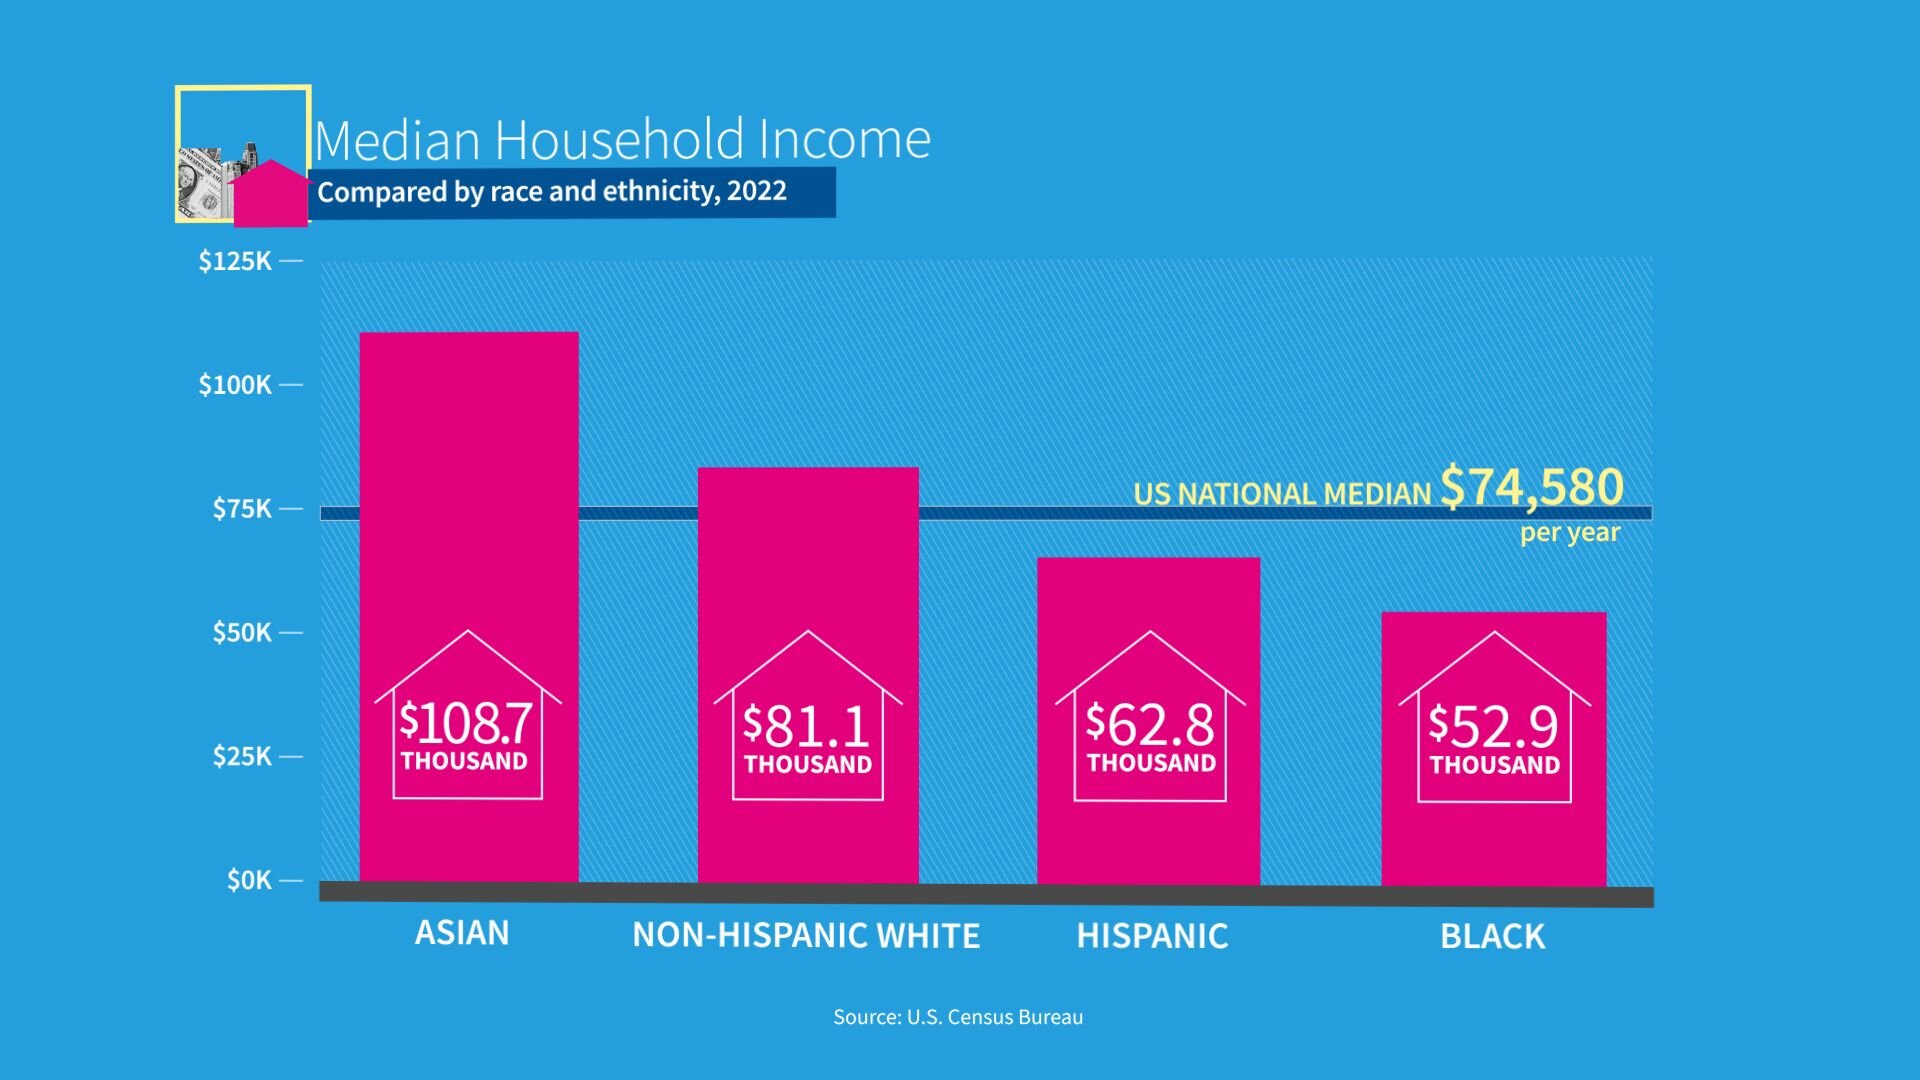
Another way to assess income is by looking at the number where half of the households now, not families, are below that income and half the households are above; that number is the median.
Median household income differs by race and ethnicity, with Asian households having the highest median income of $108,700, followed by non-Hispanic white households at $81,060. Those are both above the national median.
Hispanic households had a median income of $62,800, while black households had a median income of $52,860, which are both below the national median.
What about poverty in our country? How is that measured? There isn't a specific income number. Rather, the census uses a set of money income thresholds that vary by family size and composition to determine who is in poverty.
As an example, in 2023, a family of four with two children was in poverty if the household income was below $30,900.
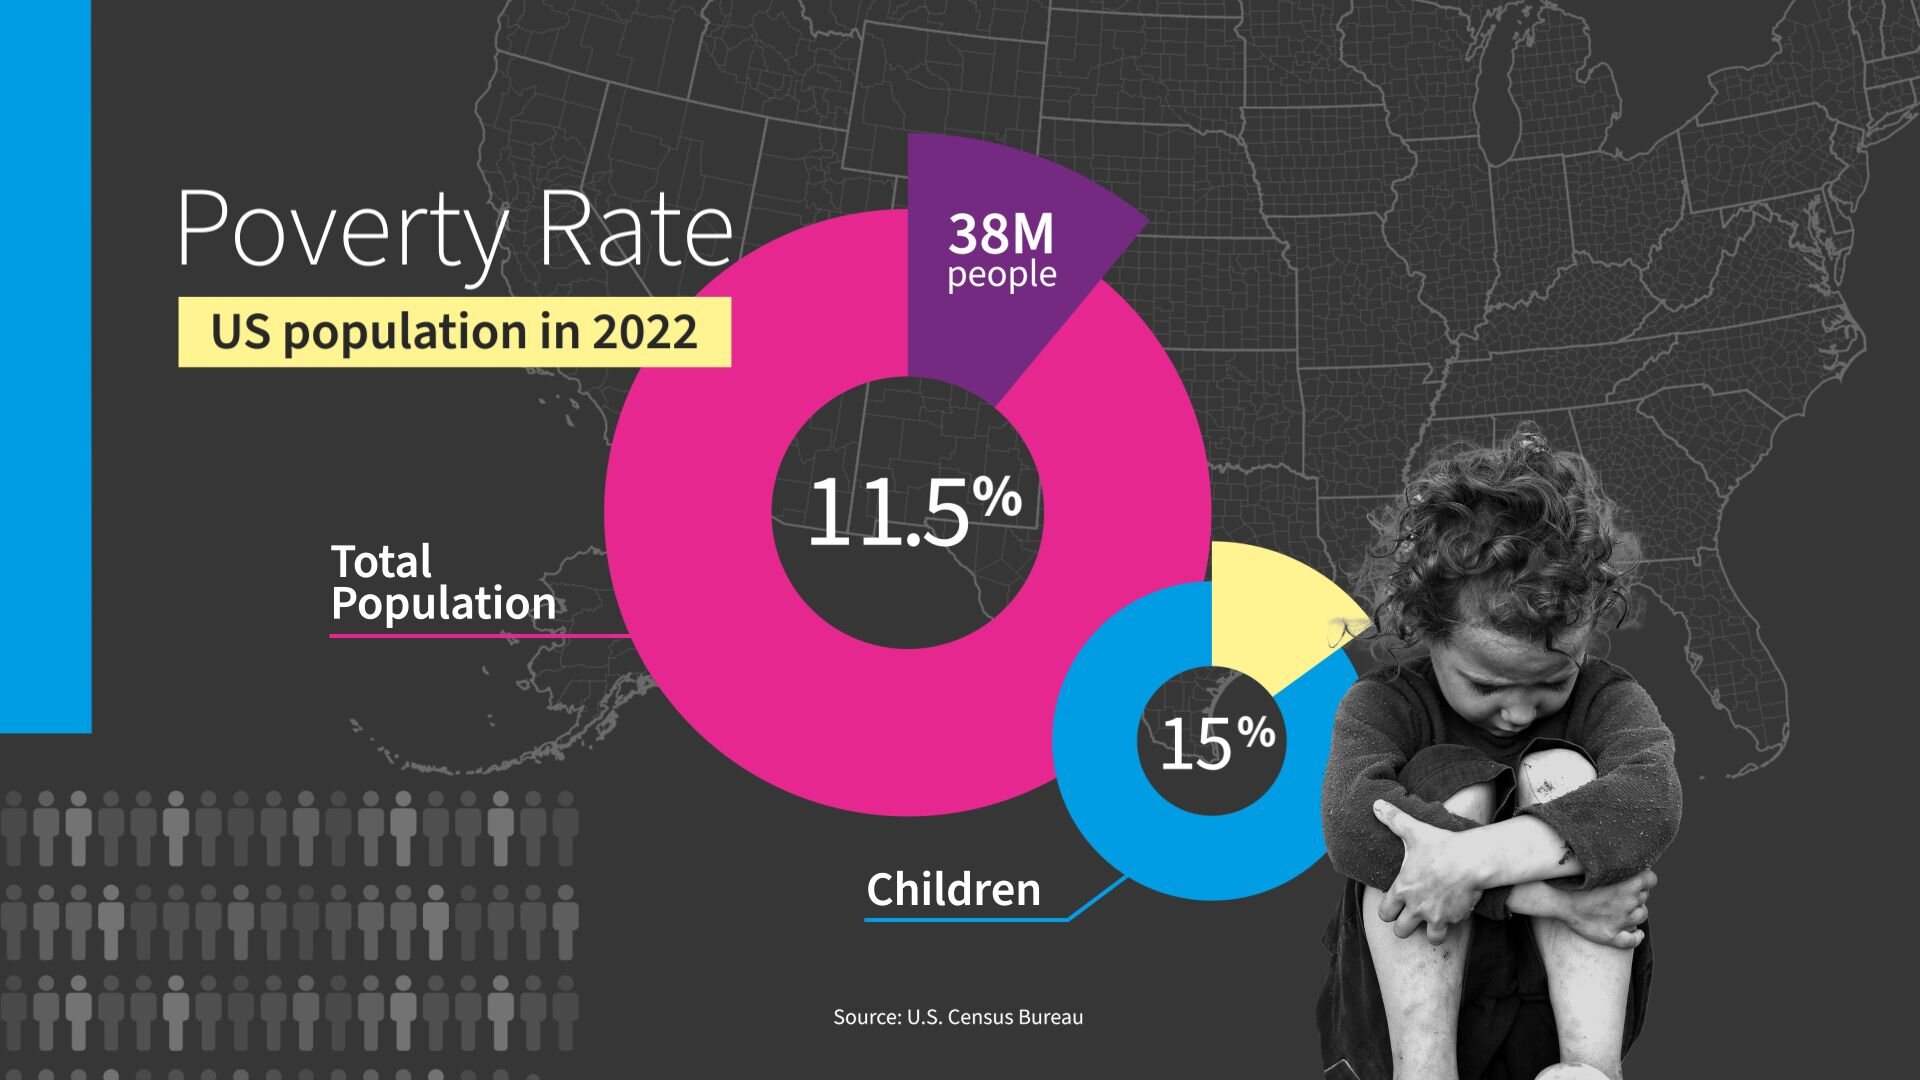
The poverty rate in 2022 was 11.5% or just under 38 million people. And 15%, actually, of all children are in poverty.
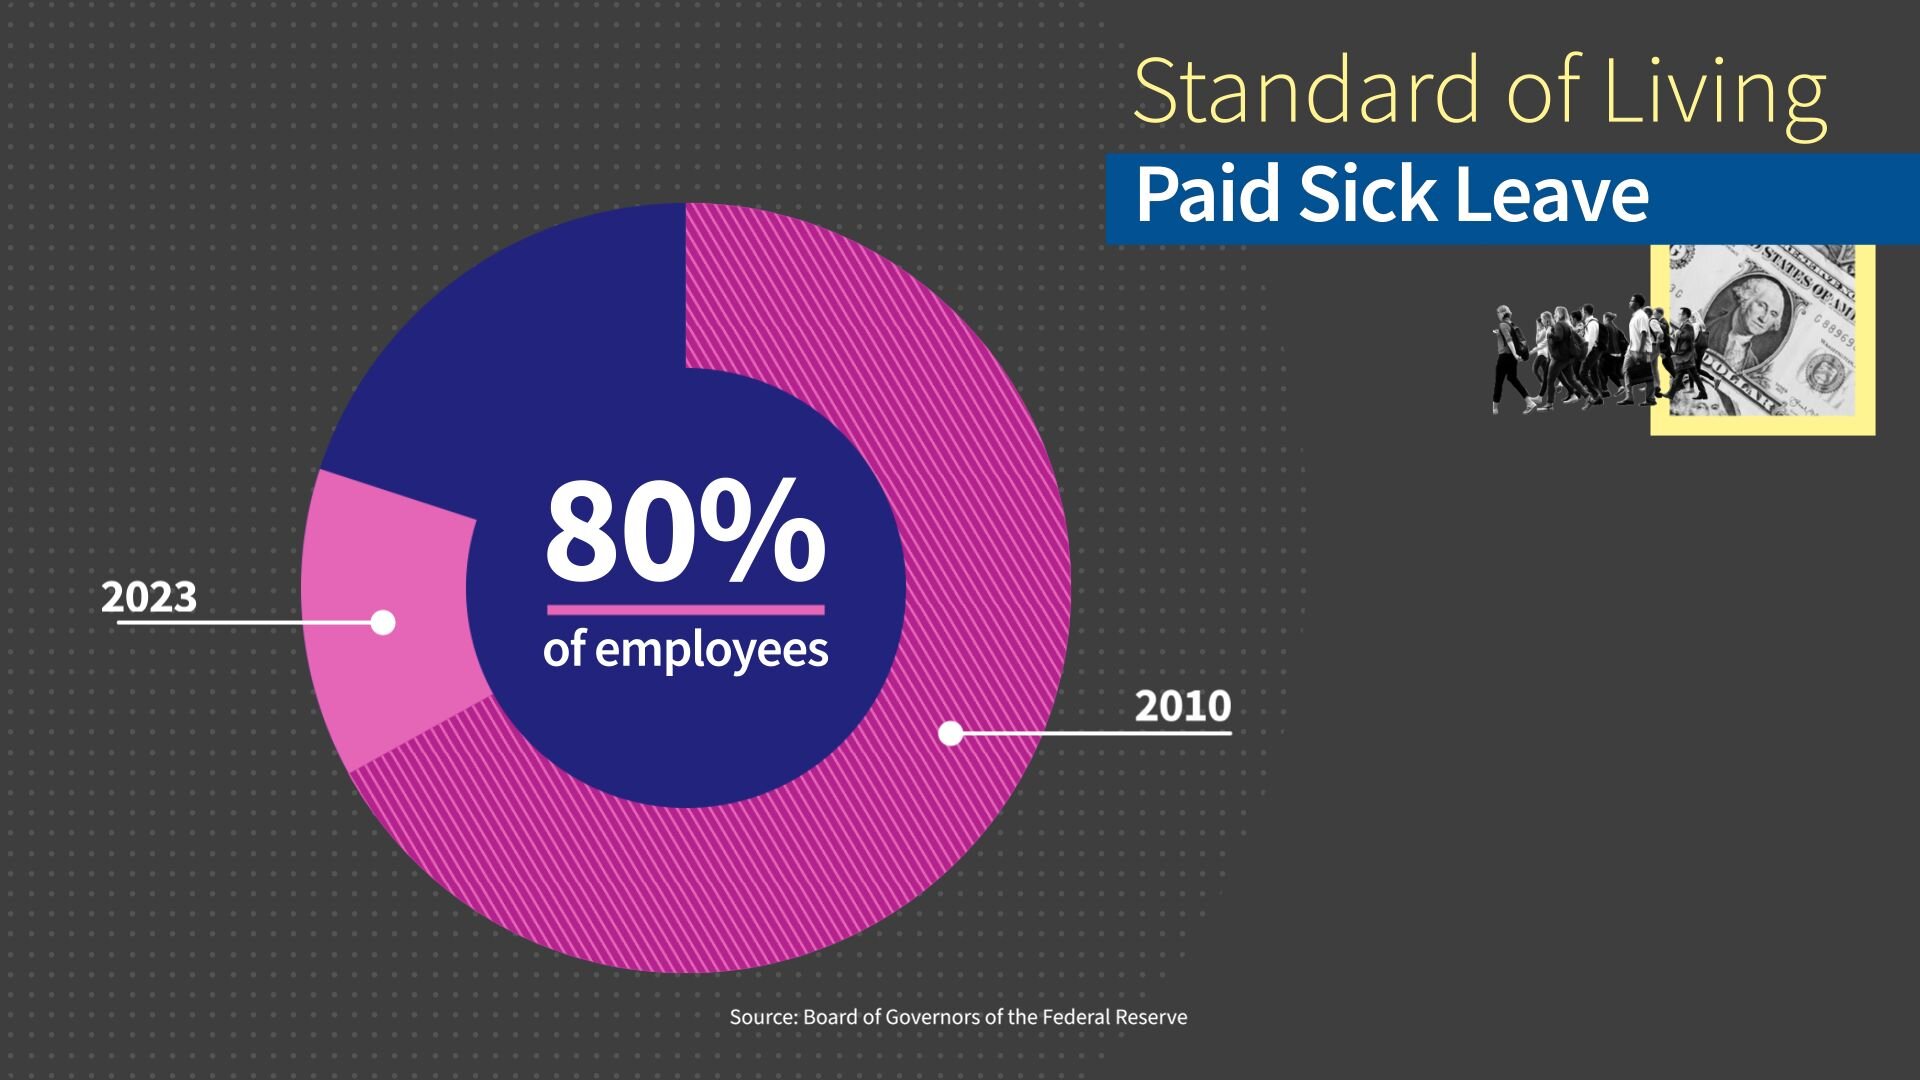
Another factor in standard of living is that more employees are getting retirement benefits, paid vacation time, sick leave and family leave than they were in 2010.
Paid sick leave went from 67% of employees to 80% in 2023.
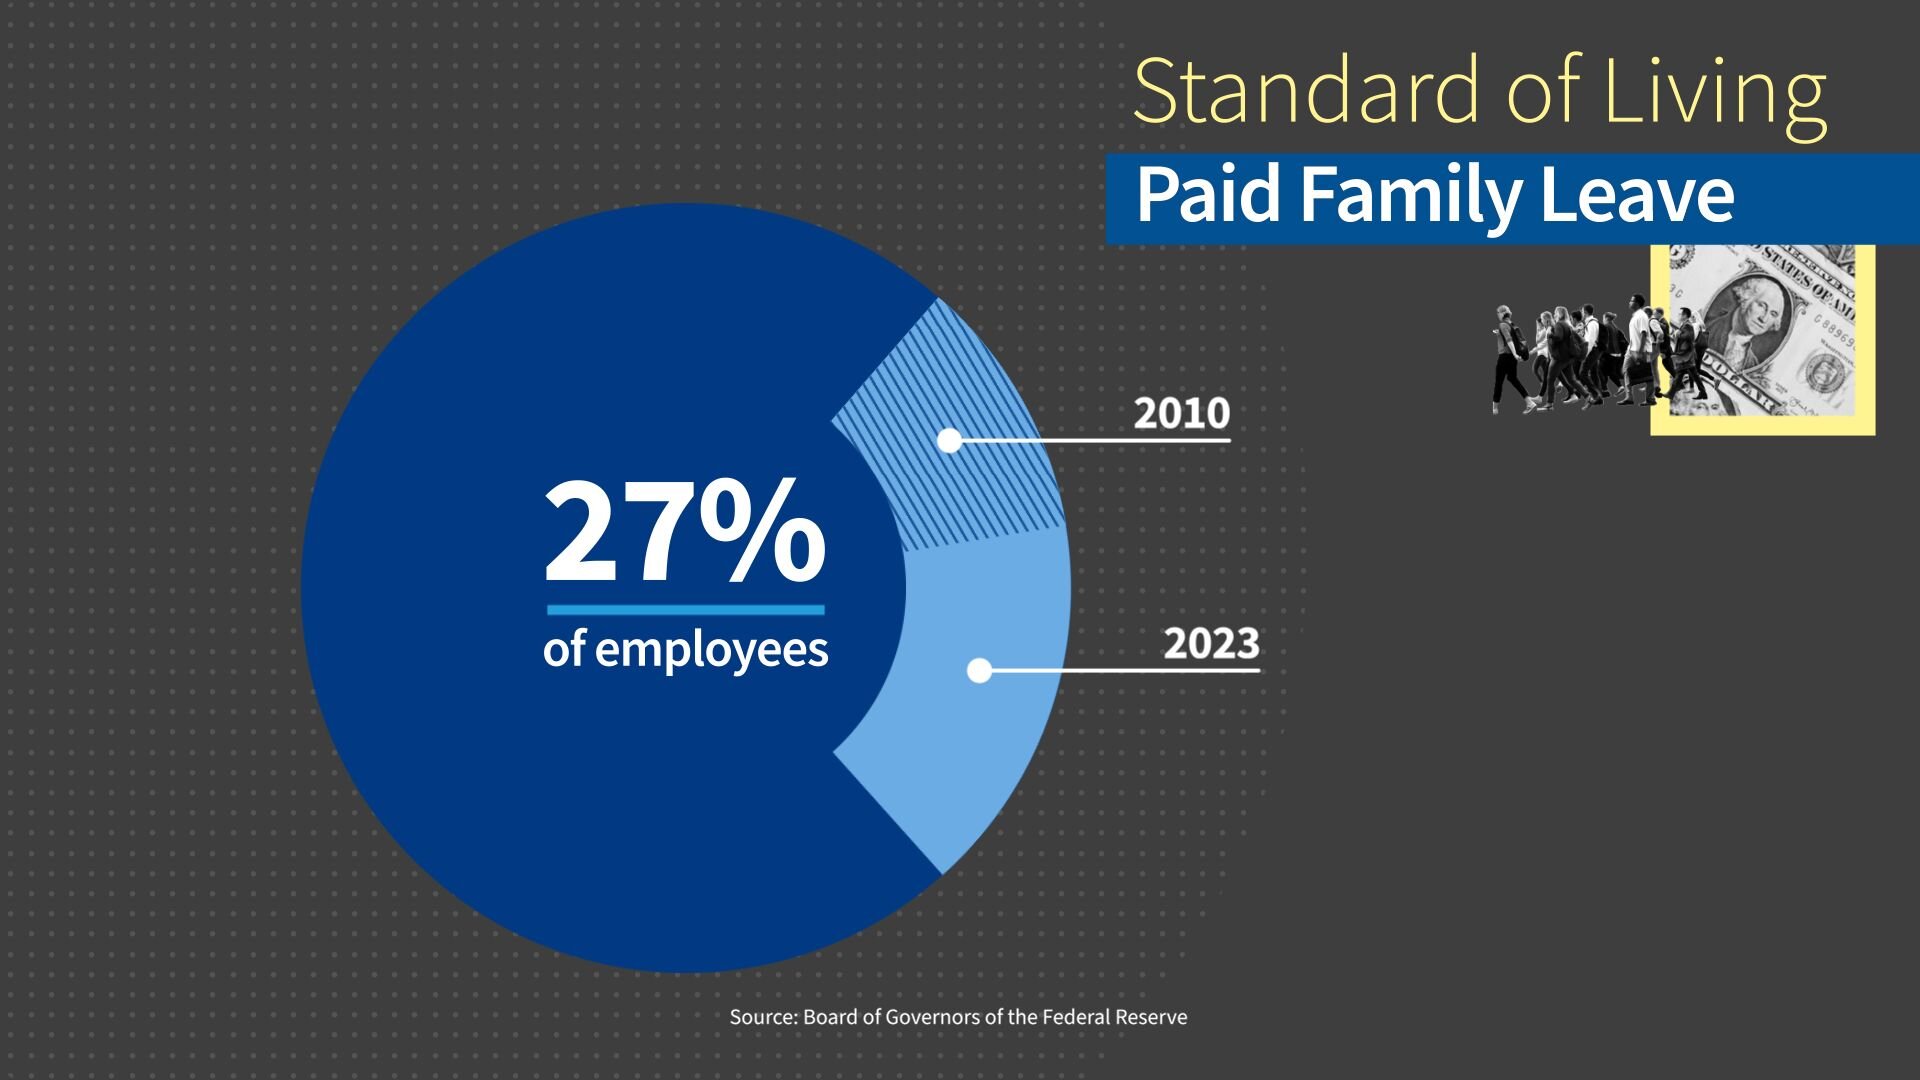
Paid family leave went from 11% to 27%.
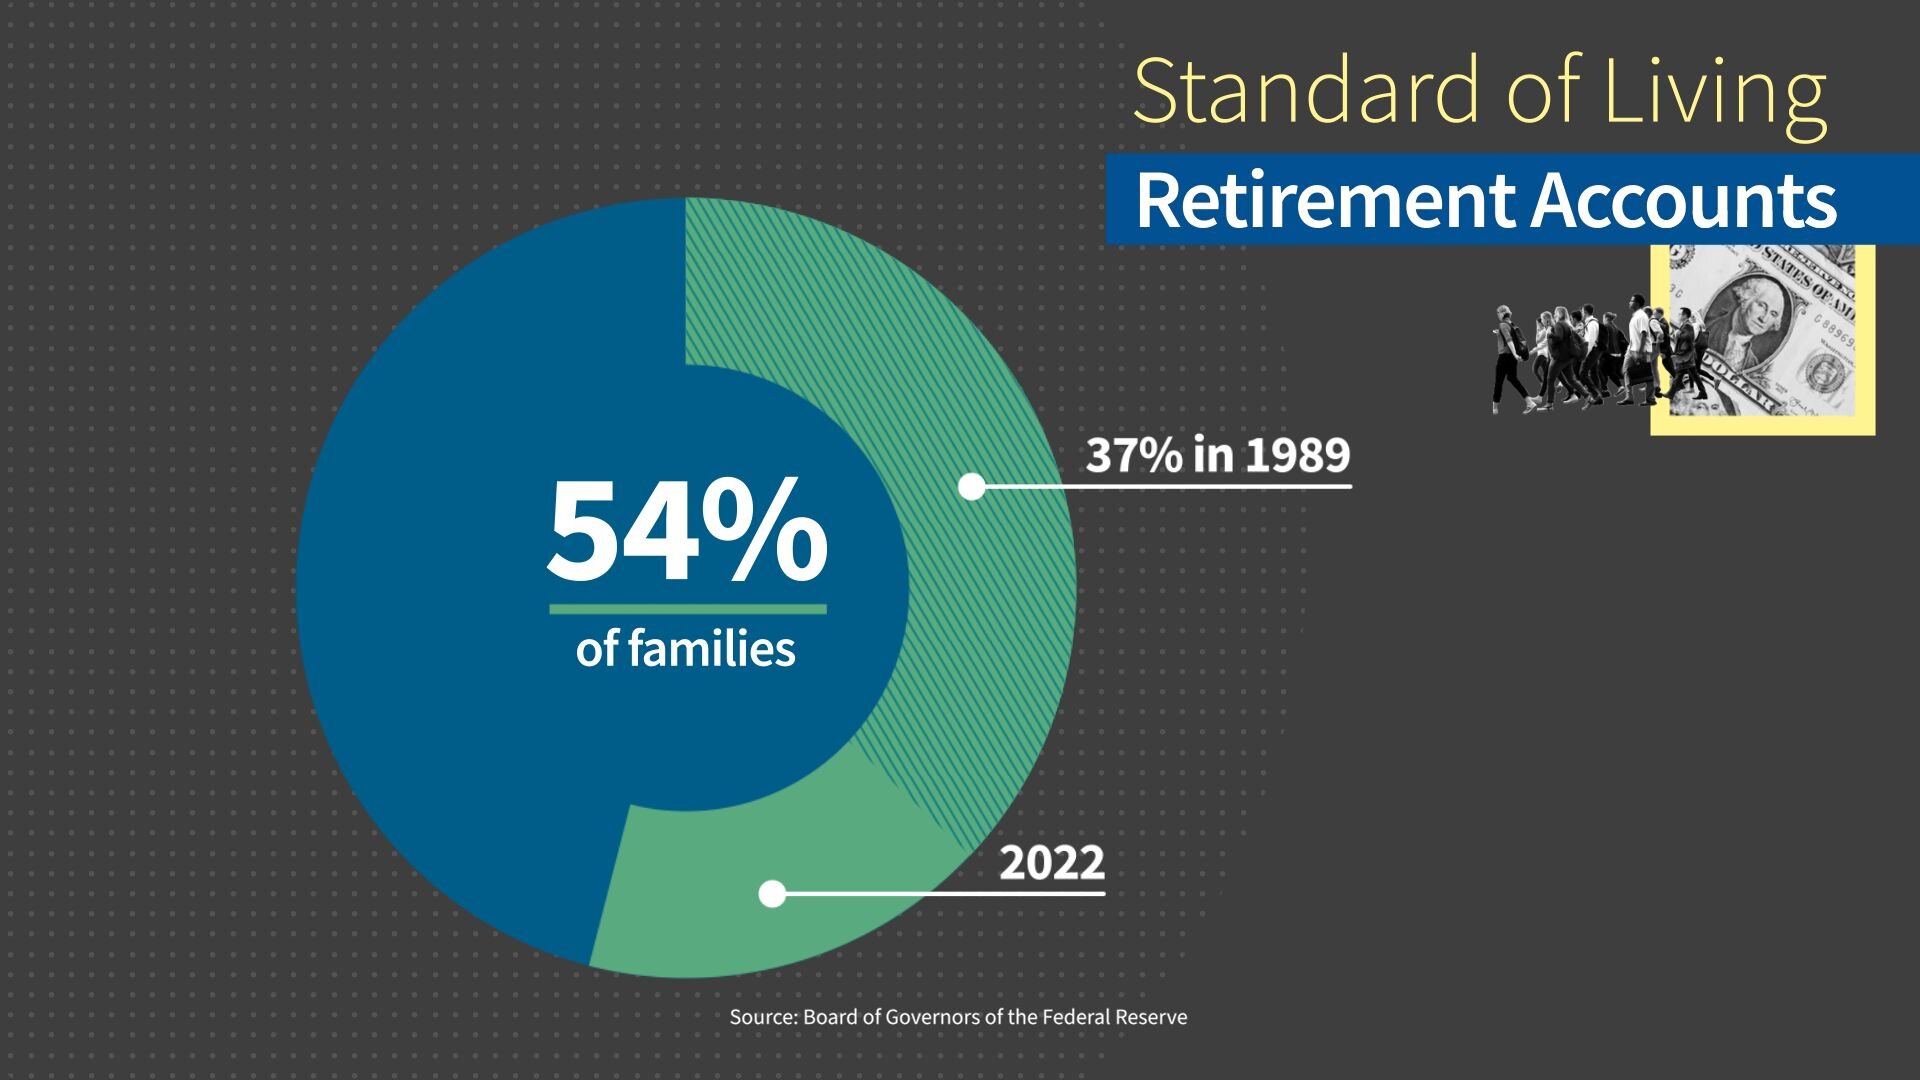
An increasing share of Americans have retirement accounts these days, too, with 54% of families having a retirement account in 2022 compared to 37% in 1989.
So, let's do a fact check.
Unemployment: 4%; down from the recent peak of the pandemic at 14.8%.
Inflation: 3.3%; down from the recent high of 9% in 2022.
Consumer prices: up 19% since the pandemic.
Job growth: 6 million new jobs from the start of the pandemic.
Mortgage rates: up to 7%.
Wages: up 2% since the pandemic after adjusting for inflation.
That wraps it up on the economy. My personal view? I continue to be amazed at the innovation and dynamism of the US economy and the work ethic of Americans.
The American worker and American economy should never ever, be underestimated. The combination of the innovation in our country and freedom is hard to beat.
That's it for the economy. Thanks for hanging in there. I hope you agree. The more we know the better voters we can be. Just the Facts from USAFacts. You decide what you believe.
Page sources and methodology
All of the data on the page was sourced directly from government agencies. The analysis and final review was performed by USAFacts.
Bureau of Economic Analysis
Gross Domestic Product
Federal Reserve Bank of St. Louis
Gross domestic product per capita and Current Employment Statistics (Establishment Survey), Total Nonfarm

