How many people speak Tamil at home?
402K
#29
California had the highest population of Tamil speakers at home.
People aged 5 or older speaking Tamil at home, (2025; 2020–2024 where 1-year data is unavailable)

Get weekly insights
Subscribe for data-driven insights. No spin, just the facts.
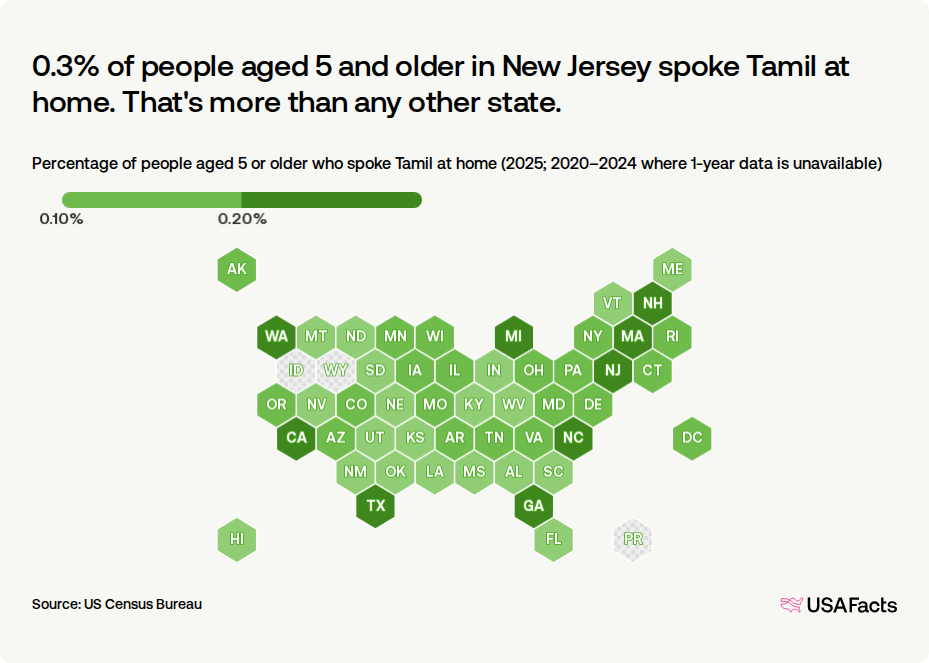
0.3% of people aged 5 and older in New Jersey spoke Tamil at home. That's more than any other state.
Percentage of people aged 5 or older who spoke Tamil at home (2025; 2020–2024 where 1-year data is unavailable)
The number of Tamil speakers at home in the US grew 47.0% since 2016.
English-speaking ability of people aged 5 or older who spoke Tamil at home, 2016–2025

Top 25 metro areas for Tamil speakers at home, 5 and older (2020–2024)
| 1. | San Jose-San Francisco-Oakland, CA CSA | 45,800 |
| 2. | New York-Newark, NY-NJ-CT-PA CSA | 35,400 |
| 3. | Dallas-Fort Worth, TX-OK CSA | 26,900 |
| 4. | Washington-Baltimore-Arlington, DC-MD-VA-WV-PA CSA | 18,300 |
| 5. | Chicago-Naperville, IL-IN-WI CSA | 13,700 |
| 6. | Atlanta--Athens-Clarke County--Sandy Springs, GA-AL CSA | 13,700 |
| 7. | Seattle-Tacoma, WA CSA | 13,600 |
| 8. | Boston-Worcester-Providence, MA-RI-NH CSA | 12,800 |
| 9. | Los Angeles-Long Beach, CA CSA | 12,000 |
| 10. | Houston-Pasadena, TX CSA | 10,400 |
Keep exploring

Methodology
USAFacts standardizes data, in areas such as time and demographics, to make it easier to understand and compare.
Page sources
USAFacts endeavors to share the most up-to-date information available. We sourced the data on this page directly from government agencies; however, the intervals at which agencies publish updated data vary.
