
The state of California in numbers
Nonpartisan data on key issues in the debate and race for California governor—economy, housing, crime and more. Whether you’re a Californian deciding how to vote or tuning in to the gubernatorial primary debate, this page puts key facts about the Golden State in one place.
Whether you’re a Californian deciding how to vote or tuning in to the gubernatorial primary debate, this page puts key facts about the Golden State in one place.
Jump to a topic
Population
California is the most populous state.
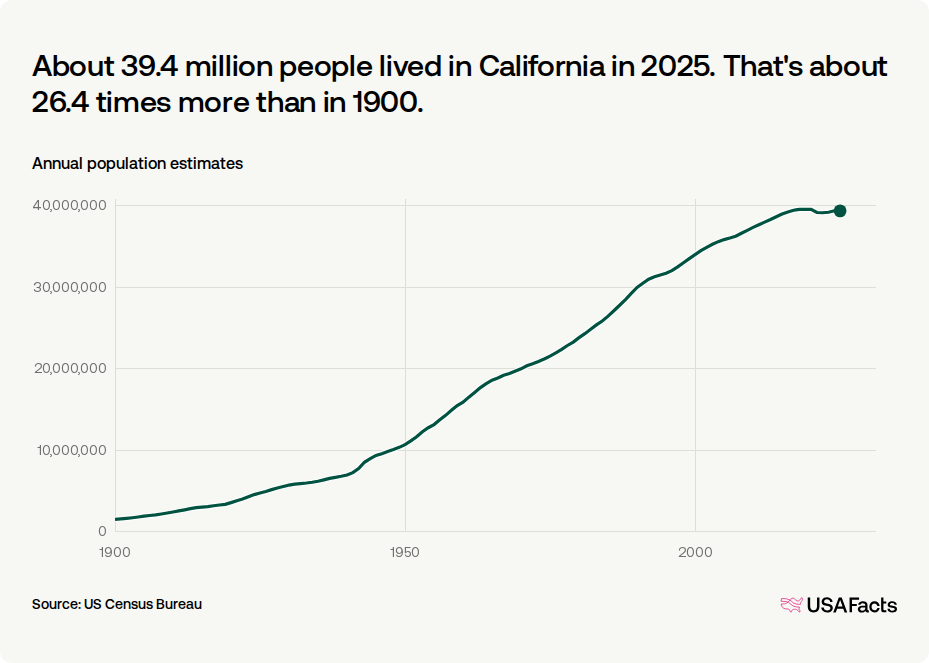
In 2025, the Golden State was home to 39.4 million people, or 11.5% of the nation's population.
- Is California's population growing or shrinking? Although it was one of five states to lose population from 2024 to 2025, its population grew 1% from 2015 to 2025.
- How many immigrants are in California? In 2024, California was home to 10.9 million immigrants, or around 2 in 7 residents.
About 39.4 million people lived in California in 2025.
Estimated population, 1900–2025
Economy
In 2025, California ranked fourth in state GDP per person.
Real gross domestic product per capita by state (2025)

In 2025, California's GDP was $3.39 trillion.
GDP measures the value of goods and services a country or state produces — it’s the sum of consumer spending, business investment, government spending, and net exports. California had the fourth-highest GDP per person out of all 50 states in 2025.
- What is the income of a Californian household? The median household income in California was $100,100 in 2024. California's median household income was 22.7% higher than the US median.
- What is the poverty rate in California? In 2024, around 4.6 million people, or 11.8% of California's population, were living under the poverty line.
- How many people receive SNAP benefits in California every month? About 5.47 million people during federal fiscal year 2025. That’s 13.9% of the state’s population.
Employment
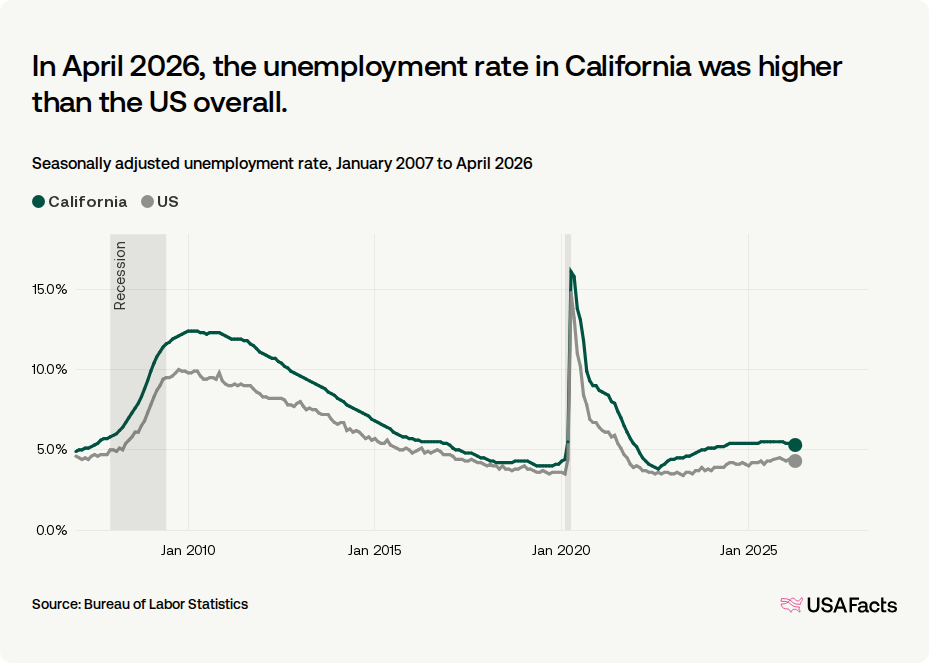
California's unemployment rate is higher than that of the US overall.
Based on the Bureau of Labor Statistics monthly unemployment rate, California's unemployment is typically higher than the national average. In February 2026, the unemployment rate was 5.4% in California, compared to 4.4% nationally.
- How many job openings are there in California? At the end of 2025, California's job openings rate, was 3.2%. That was lower than the national average of 3.9%. There were about 588,000 job openings.
- How many people are laid off in California each month? In December 2025, layoffs were 6.3% higher than in December 2024.
- What percent of jobs in California are held by immigrants? About 33.3% of jobs in 2023.
In February 2026, the unemployment rate in California was higher than the US overall.
Seasonally adjusted unemployment rate, January 2007 to February 2026
Crime
In 2024, both the violent and property crime rates in California were higher than the US average.
Property and violent crimes per 100,000 people

Crime rates in California were higher than the US averages.
Compared to the US average, the violent crime rate in 2024 in California was 35.3% higher, and its property crime rate was 18.1% higher.
- How many people are in prisons in California? In 2023, the most recent year of available data, about 96,000 people were incarcerated.
- How many people die from gun-related injuries in California each year? In 2024, the most recent available year of data, an estimated 2,900 people died from gun-related injuries. That's around 7 in 100,000 people.
Ask USAFacts
More data on the Golden State
How red or blue is California?
Explore data from 10 previous elections here, and see how Californians have voted for the president, Congressional representatives, and the governor.
US states have elected 26 Republican governors and 24 Democratic governors.
Political party of state governors and governors-elect, December 9, 2025

How many disasters are declared in California?
On average, 10 disasters are declared per year, according to the last five full years of FEMA data.
California declared 48 disasters in the last 5 years.
Number of disaster declarations by disaster incident type, January 1980–March 2026

How much do Californians pay in gas taxes?
As of January 2026, California's gas taxes — excise taxes and other state taxes and fees — were the highest in the nation.
California taxes gas at the highest rate of any state: $0.71 per gallon.
Average state gasoline taxes per gallon, total and by type (January 2026)
What is USAFacts?
USAFacts exists to make government data easier to access and understand. We don’t tell you what to think. We give you what you need to make informed decisions.
Our government is complex. Our data doesn’t have to be.
Subscribe to our weekly newsletter to get data-backed answers to today’s most debated issues