What is the poverty rate in California?
Refreshed monthly
The poverty rate was about 11.8% of California’s population as of 2024. The poverty rate is the percentage of people whose household income falls below the poverty threshold set by the government. It measures the percentage of people in households that don’t earn enough to pay for basic needs like food, housing, and healthcare. In 2024, 4,567,967 people in California were considered in poverty.
11.8%
of the population (2024)
4.57M
people living under the poverty line (2024)
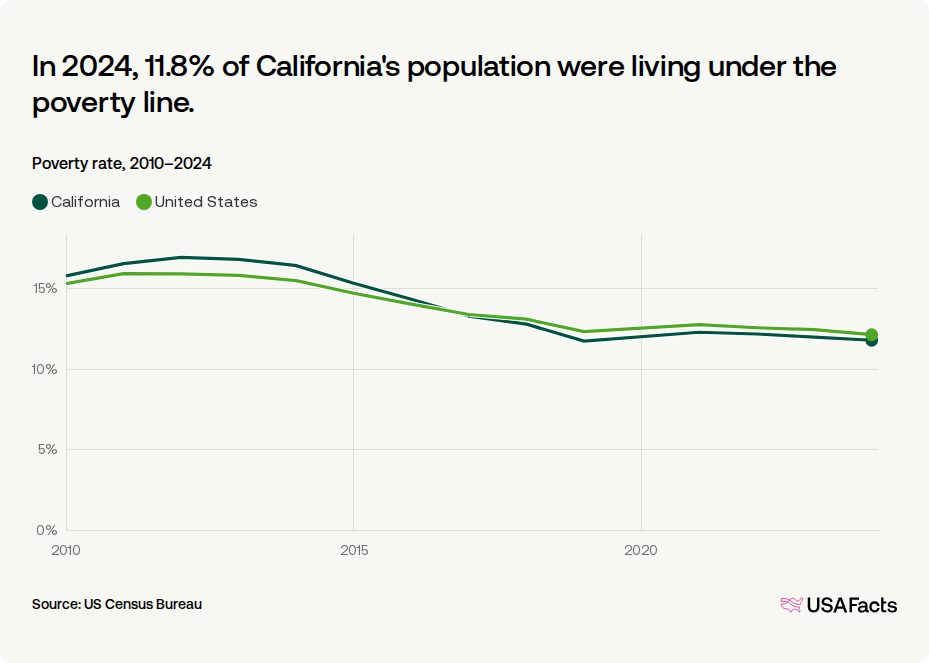
Based on data from the American Community Survey dating back to 2010, California's poverty rate hit a peak in 2012 of 17%. Its lowest point was in 2019 at 11.8%. The state's poverty rate was 11.8% in 2024, 0.2 percentage point higher than the previous year.
In 2024, 11.8% of California's population were living under the poverty line.
Poverty rate, 2010–2024
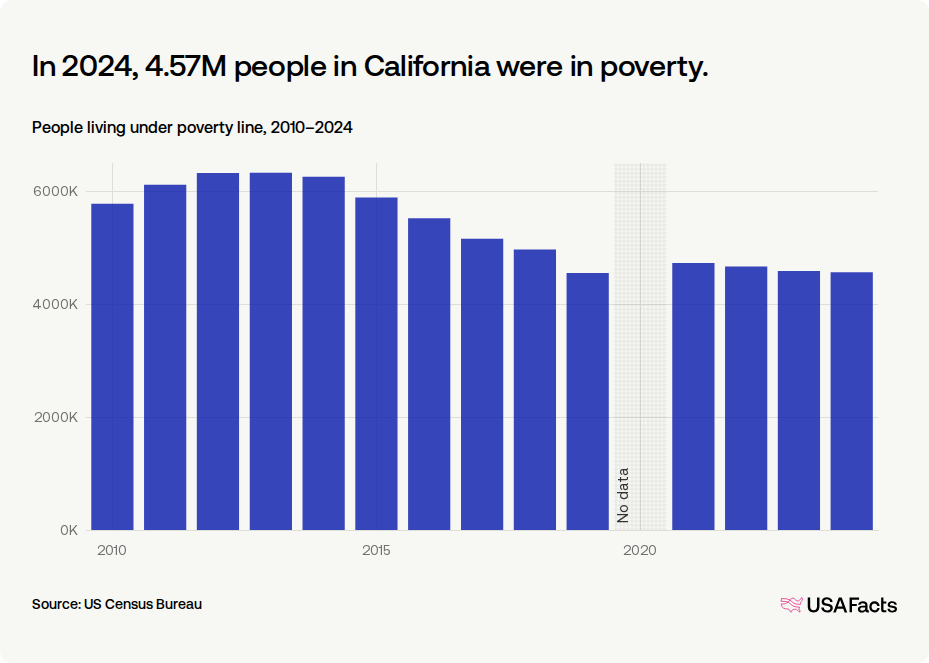
While the poverty rate shows the overall trend, the total number matters because many aid programs and funding decisions are based on how many people are in poverty, not just the percentage. In 2024, 4,567,967 people living in California were in poverty — down 27.8% from the 2013 peak of 6,328,824.
In 2024, 4.57M people in California were in poverty.
People living under poverty line, 2010–2024
Poverty doesn’t affect all groups equally. Rates vary widely by demographic group, family type and location.
What is the child poverty rate in California?
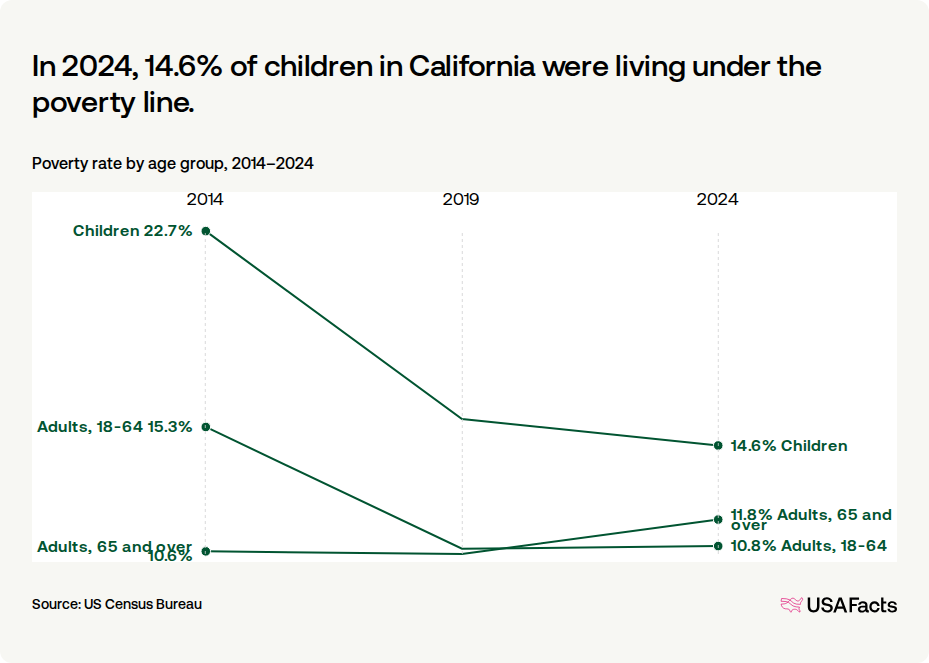
From 2014 to 2024, the poverty rate for children under 18 in California decreased from 22.7% to 14.6%. During the same period, the poverty rate for adults under 65 years decreased from 15.3% to 10.8%. For those older than 65, the poverty rate increased from 10.6% to 11.8%.
In 2024, 14.6% of children in California were living under the poverty line.
Poverty rate by age group, 2014–2024
How does poverty differ by race in California?
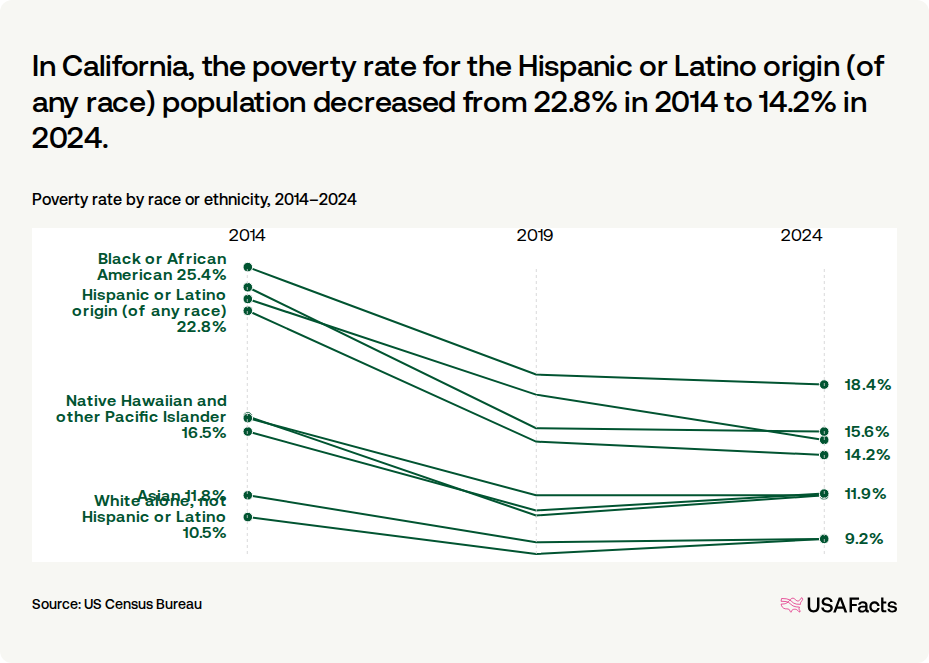
Among racial or ethnic groups in California during 2024, five had a higher poverty rate than the state’s overall rate: American Indian and Alaska Native, Black or African American, Hispanic or Latino origin (of any race), some other race, and two or more races.
Two had a lower than average poverty rate: White alone, not Hispanic or Latino; and Asian.
Over the previous ten years, the poverty rate for the Hispanic or Latino origin (of any race) population shifted the most, decreasing from 22.8% in 2014 to 14.2% in 2024.
In California, the poverty rate for the Hispanic or Latino origin (of any race) population decreased from 22.8% in 2014 to 14.2% in 2024.
Poverty rate by race or ethnicity, 2014–2024
What counties in California have the highest and lowest poverty rates?
In 2019-2023, the poverty rate among California counties ranged from 6.5% in San Mateo County to 20.3% in Modoc County. The poverty rate in the state’s largest county — Los Angeles County — was 13.6%.
In 2019-2023, the poverty rate among California counties ranged from 6.5% to 20.3%.
Poverty rate

Poverty rate, by county (2023)
| 1. | Modoc County | 20.3% |
| 2. | Madera County | 19.9% |
| 3. | Imperial County | 19.6% |
| 4. | Kern County | 19.0% |
| 5. | Humboldt County | 18.9% |
| 6. | Fresno County | 18.7% |
| 7. | Merced County | 18.4% |
| 8. | Butte County | 18.3% |
| 9. | Trinity County | 18.0% |
| 10. | Tulare County | 17.8% |
Keep exploring
Methodology
USAFacts standardizes data, in areas such as time and demographics, to make it easier to understand and compare.
Page sources
USAFacts endeavors to share the most up-to-date information available. We sourced the data on this page directly from government agencies; however, the intervals at which agencies publish updated data vary.
