These three metro areas have some of the most competitive housing markets in the country, with both low supply and high demand: San Jose-Sunnyvale-Santa Clara, California; Manchester-Nashua, New Hampshire; and Rochester, New York.
The Omaha-Council Bluffs market in Nebraska and Iowa is the most supply-constrained housing market in the country, with an average of 0.75 active listings per 1,000 households in the first quarter of 2023. This is 84% lower than the nationwide average of 4.59.
How is a competitive housing market determined?
Traditionally, a competitive housing market is measured through the balance of housing supply and demand. This article focuses on two metrics: days on the market and active listings.
When a lot of people are on the market trying to buy a home, houses tend to be bought quickly. When a city has a low median number of days on the market for available homes, it indicates high demand for the available houses. The nationwide average was around 65 days for the first three months of 2023.
Supply constraints also make a housing market more competitive. Cities with a low number of houses available have more competitive housing markets. Some cities have less than one available home for every 1,000 households. Nationwide in the first quarter of 2023, there were 4.59 homes on the market per 1,000 households.
Which cities have the lowest supply of housing for sale?
The Omaha, Nebraska metro area has the lowest housing supply, at 0.75 available homes for sale per 1,000 households. in the area have resulted in a decrease in housing inventory over the past few decades.
The next five most supply-constrained metro areas for housing include three college towns: Cape Girardeau on the border of Missouri and Illinois; South Bend-Mishawaka bordering Indiana and Michigan; Ithaca, New York; — San Jose-Sunnyvale-Santa Clara, California; and St. Louis. These metro areas all have less than 1.25 homes on sale per month for every 1,000 households.
Across the US, housing supply trends also emerge.
The southern US tends to have a higher number of houses on sale. Three of the five cities with the most houses on sale are in Florida, with Crestview-Fort Walton Beach-Destin topping the list at 20.9 houses per 1,000 households. Meanwhile, many cities along the West Coast and in bigger Midwestern cities are very supply constrained.
Which cities have housing markets with the quickest turnaround?
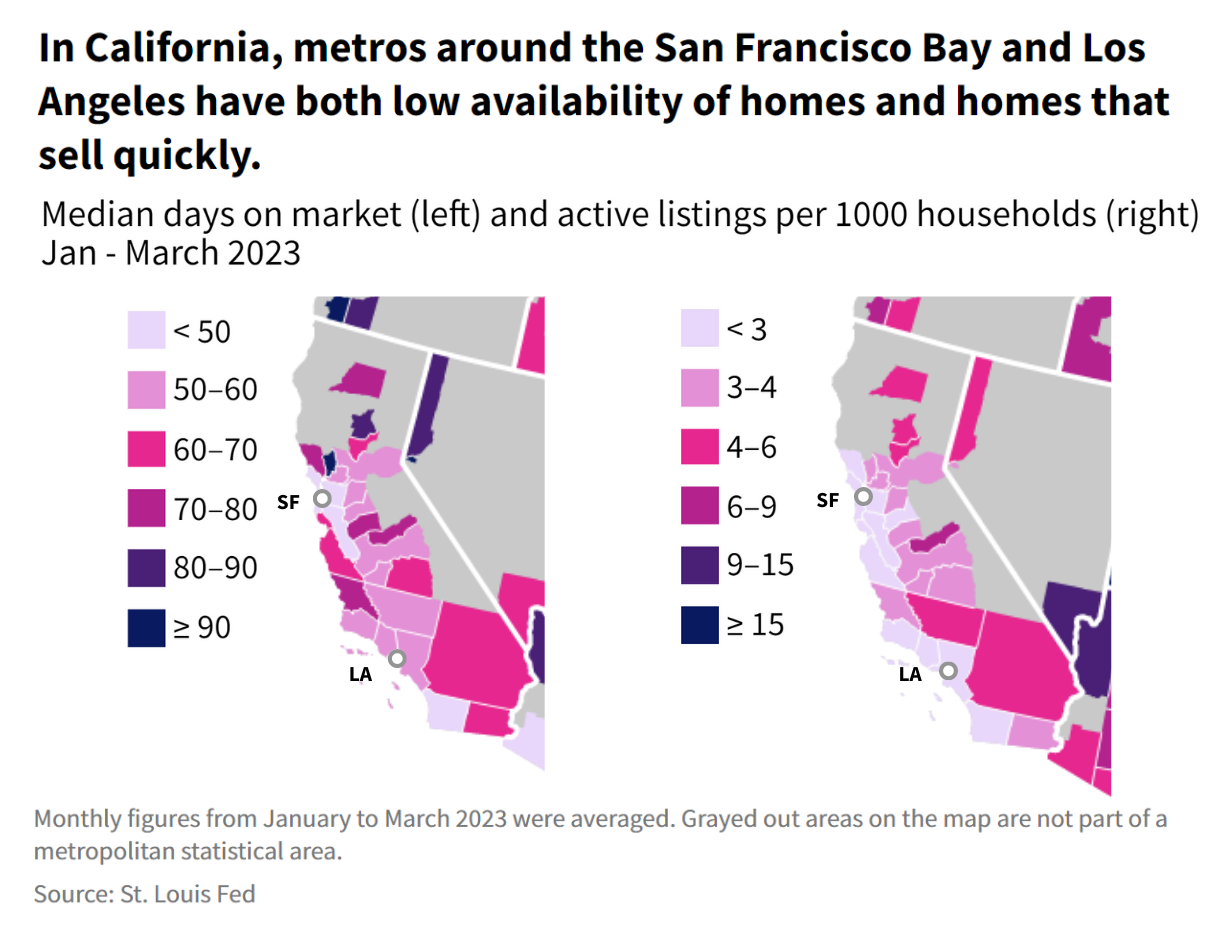
Cities with fast-moving housing markets place a higher burden on homebuyers to find and close deals quickly. Over the first three months of 2023, three metro areas had houses on the market for less than a median of 40 days: Rochester, San Jose-Sunnyvale-Santa Clara, and Manchester-Nashua.
There aren’t many nationwide trends that emerge for active listing times. However, comparing active listing times to housing supply reveals interesting dynamics in different regions of the US.
In California, the metro areas with the least active listings also tend to have houses that sell the fastest. These two metrics show a highly competitive housing market. This is also the case in Massachusetts: there are few active listings, and houses sell quickly.
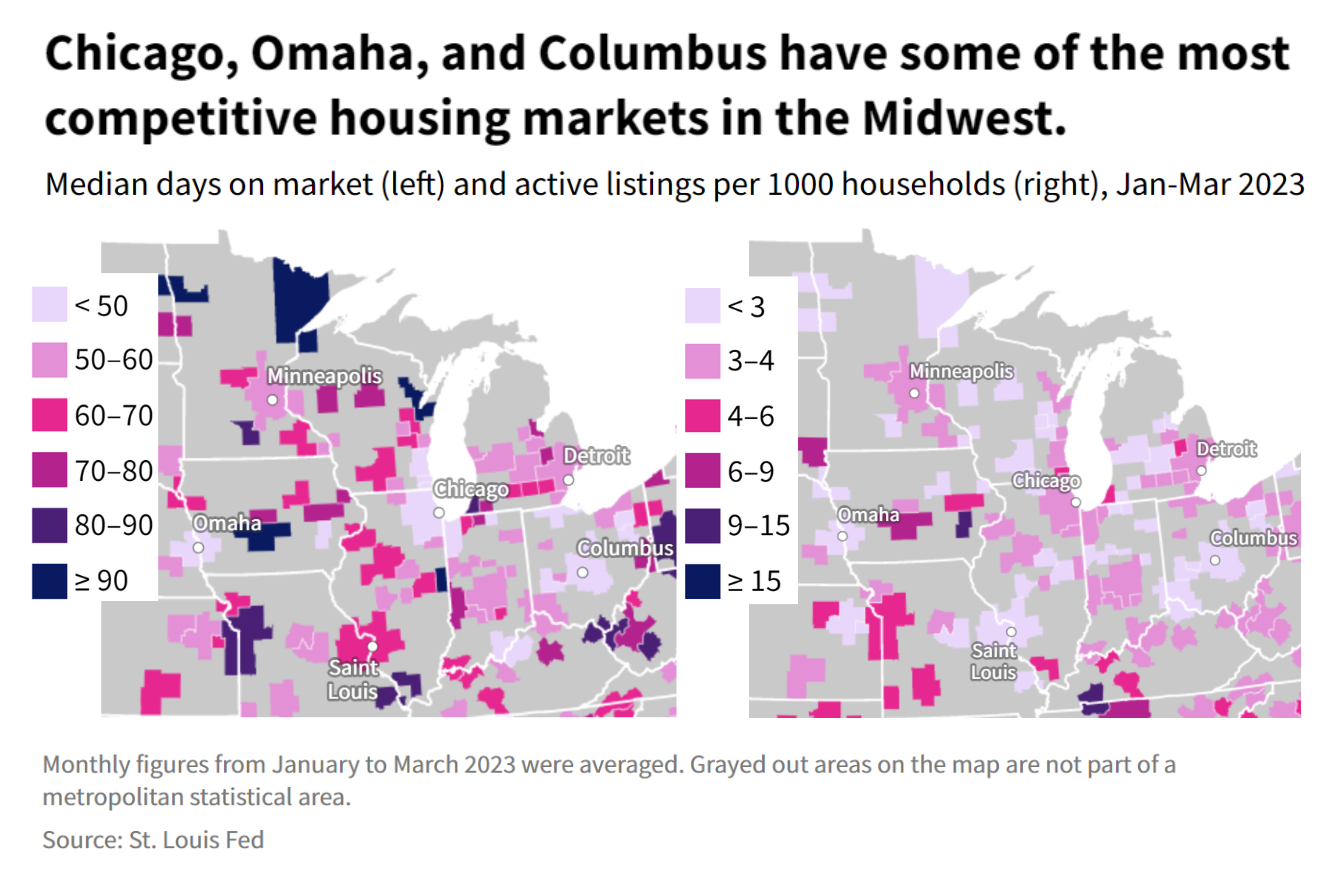
This pattern is less consistent in the upper Midwest. The region does not have many homes on sale, but the length of time it takes to sell depends significantly on the metro area. Houses around Chicago; Omaha; and Columbus, Ohio sell quickly, whereas it takes longer to sell a house in St. Louis or Wisconsin overall.
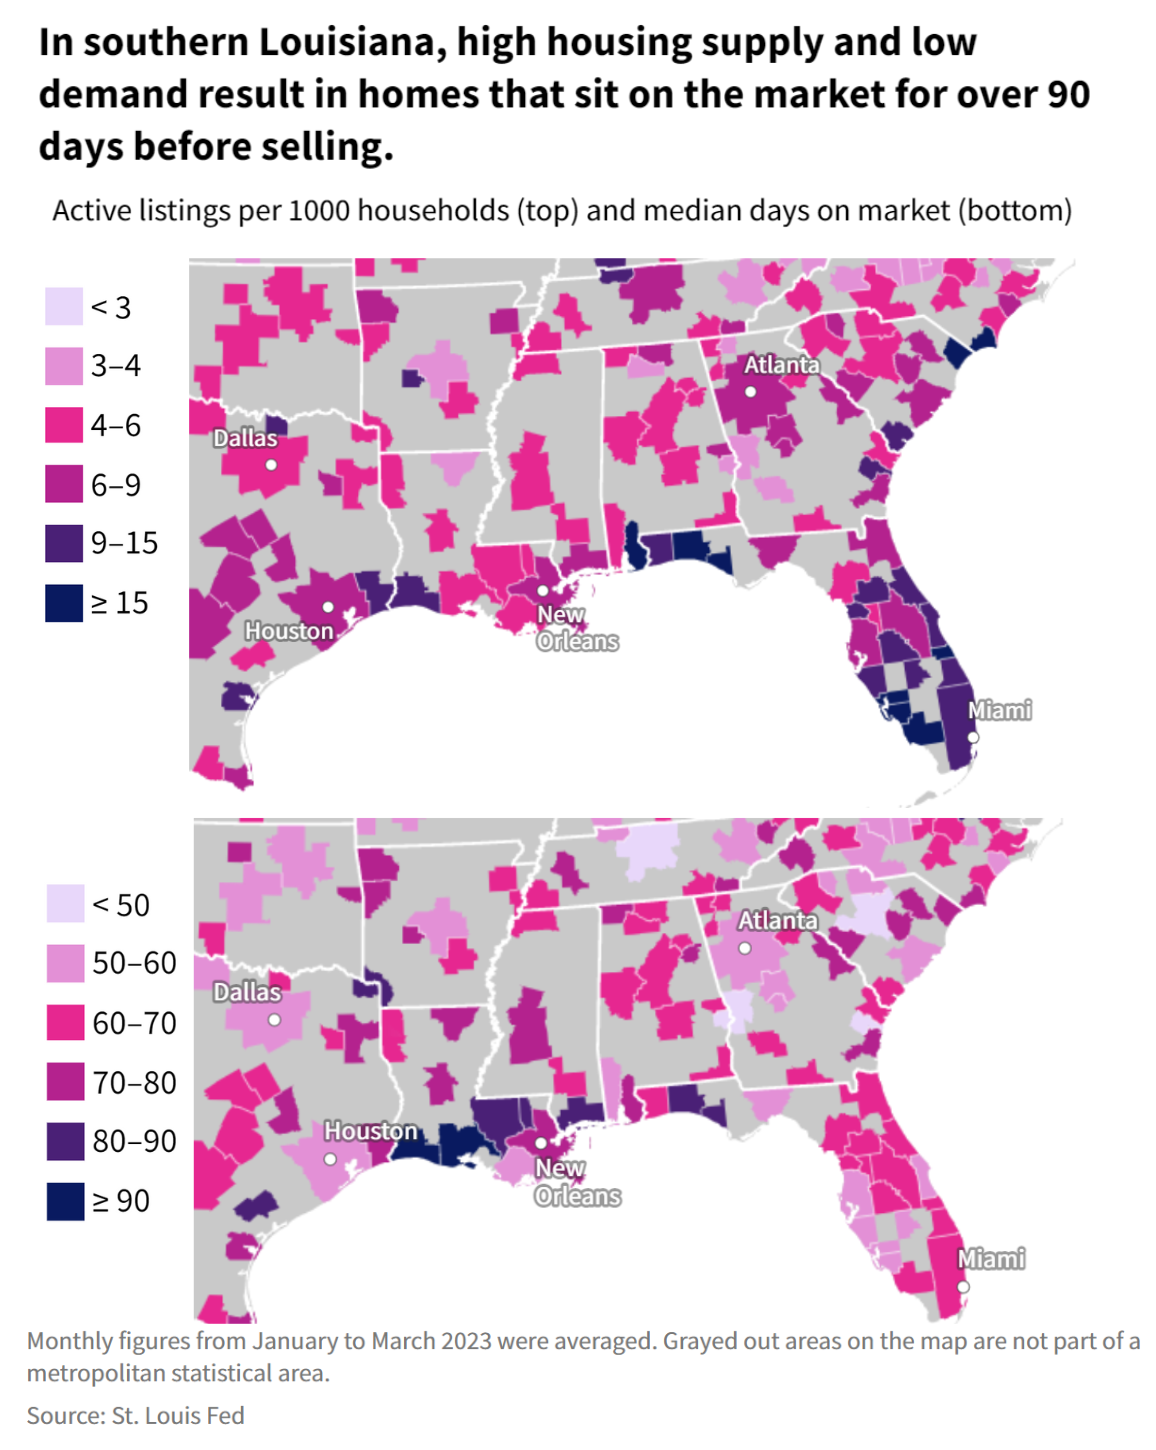
The South has a high housing supply but people in some cities have an easier time selling homes than others. Houses in Florida, for example, are selling much quicker than in Louisiana.
While housing supply and time on market highlights some of the country’s most competitive housing markets, other factors such as cost and employment also influence a homebuyer’s experience. In most of the Western US and almost every predominantly urban county, a single average earner couldn’t afford to buy a median-priced home in their county in 2022. Additionally, the cost of homes in the United States has outpaced wage growth over the past decade.
Read more about how housing prices compare to wage growth and the standard of living in the US, and get the facts every week by signing up for our weekly newsletter.
Keep exploring
Page sources and methodology
All of the data on the page was sourced directly from government agencies. The analysis and final review was performed by USAFacts.
Federal Reserve Bank of St. Louis
Housing Inventory Core Metrics
