What’s in the “One Big Beautiful Bill”?
From tax reform to shifts in healthcare, immigration, and SNAP, this legislation will likely affect you.
Congress has passed its next major spending bill. This legislation, called the “One Big Beautiful Bill Act,” would lower some taxes, change funding for various federal programs, raise the debt ceiling, and change many other parts of the federal government with the goal of aligning with the Trump administration’s priorities.
The bill was negotiated through a process called reconciliation, which Congress can use to change laws that affect the country’s budget. The process limits the time the Senate can spend debating to 20 hours, eliminating the possibility of a filibuster. It also means that the bill can pass with a simple majority of 51 votes in the Senate (or 50 plus the vice president’s tie-breaking vote) rather than the supermajority of 60 votes typically needed to avoid a filibuster.
Interested in when some of these changes might take effect? Check out this detailed timeline.
Healthcare: Medicaid and uninsured rates
The bill approved cuts to Medicaid, a health program jointly run by states and the federal government to help people with limited income cover medical costs. It’s funded through mandatory federal spending which renews automatically each year without needing Congressional approval.
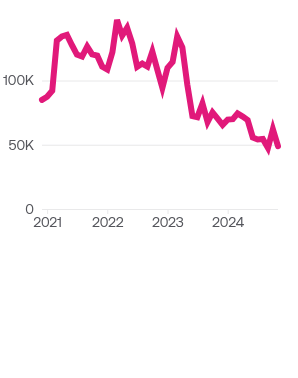
In 2022, when Medicaid had between 92 million and 98 million enrollees, nearly one in four Americans (23.5%) received Medicaid or CHIP assistance.
The Congressional Budget Office estimates that the proposed changes to Medicaid and health insurance would increase the number of uninsured people by 16 million in 2034.
In 2023, 92.0% of the nation’s 334.9 million population were covered by health insurance. Over 91% have had health insurance since 2016. The Affordable Care Act, which went into effect in 2014, expanded Medicaid eligibility.
Taxes and economic impact
The new bill cements some tax-related provisions of the 2017 Tax Cuts and Jobs Act (TCJA), including the individual tax brackets and the increased standard deduction. The bill expands a TCJA-imposed cap on the state and local tax (SALT) deduction from $10,000 to $40,000 per taxpayer for households earning under $500,000. It also reduces the child tax credit and adds new provisions, including deductions for income on tips or overtime work.
The average effective federal income tax rate declined from 14.4% in 2017 to 13.0% in 2018 (after accounting for changes to tax rates and brackets, deductions, and credits). Tax rates declined the most for people making between $500,000 and $1 million per year.
The bulk of individual income taxes are paid by wealthier Americans, and even more so between 2017 and 2022. However, these trends are at least in part due to earnings growth, as the share of tax returns in high-income AGI groups rose during this period.
The bill also cuts business taxes, including increased deductions for equipment and research costs. Corporate income tax made up 11% of total federal tax revenue in 2024.
SNAP benefits
The bill proposes cuts to, and stricter work requirements for, the Supplemental Nutrition Assistance Program (SNAP, also previously known as food stamps). SNAP is a federal program that helps provide food assistance to low-income people.
In fiscal year (FY) 2024, 41.7 million people, or 12.3% of the US population, received monthly SNAP benefits. On average, there have been more than 40 million program beneficiaries each month since 2010, with the exceptions of 2019 (35.7 million participants) and 2020 (39.9 million).
The SNAP program primarily helps people that don’t earn enough to pay for basic needs like food, housing, and healthcare. In 2023, the rate of people who couldn’t afford these basic needs, known as the poverty rate, was 11.1%. That figure has shifted in the last decade, with the highest poverty rate being 14.8% in 2014, and the lowest rate in 2019 at 10.5%.
SNAP, which is run by the Food and Nutrition Service, spent 1.5% of all federal funding in FY 2024, or $100 billion. That year, the monthly SNAP benefits per person was $188 dollars. Funds are deposited into an electronic benefits transfer system (similar to a debit card) which beneficiaries can use to spend at SNAP-authorized food retailers.
Immigration and border security
The new bill provides billions in expanded funding to government agencies, including Immigration and Customs Enforcement (ICE) and Customs and Border Protection (CBP), to support immigration enforcement and deportations.
CBP and ICE were the third- and fourth-highest funded Department of Homeland Security (DHS) agencies in 2024, with budgets of $12.1 billion and $10.0 billion.
Overall DHS spending has increased 64% since 2003 after adjusting for inflation. This was driven in part by a 137% increase in CBP funding and a 185% increase in ICE funding.
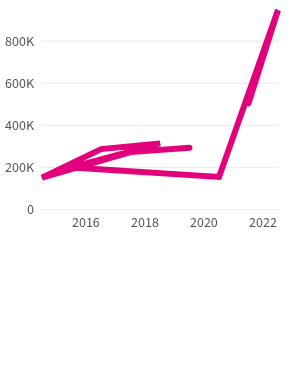
Also included in the bill are additional and increased fees for various immigration procedures, including applying for asylum. The US had a record asylum applications in 2023: nearly 1 million.
Increased defense spending
The bill increases defense spending, including funds for personnel support (housing allowances, childcare), naval shipbuilding, missile defense, weapons development, and nuclear forces.
Defense spending comprises costs related to military equipment, personnel compensation, research and development, and operational costs. Funding primarily comes from the Department of Defense, along with the Department of Justice, Department of Homeland Security, and other agencies.
In FY 2024, defense spending was 12.9% of the federal budget, or $873 billion. Defense spending has exceeded $800 billion every year since 2019. Adjusted to 2024 dollars, defense spending was highest during WWII. Since then, the biggest spending was $995 billion in 2010.
The defense share of federal spending is lower than FY 2023. Its share of spending has declined gradually since the 1950s.
Changes to energy policy
The bill introduces changes to the country’s energy policies, including expanding access for and reducing costs to develop fossil fuels, and adjusting fees and revenues of renewables.
Since the mid-20th century, fossil fuels (coal, natural gas, and crude oil) have been the top forms of US-made energy. In 2023, they accounted for 75% of energy production.
Natural gas and crude oil production have both increased since 2008. Natural gas surpassed coal production in 2011, while crude oil surpassed coal in 2015.
Coal production, on the other hand, has dropped 50% since 2008. In 2023, it was 11.5% of all US energy production.
Although renewable energy production has grown over the past decade, it still made up just 8.2% of total energy production in 2023. Over that same period, wind energy output roughly doubled, while solar energy grew sevenfold. The bill would end wind and solar tax credits for new projects.
In 2022, the energy sector employed 8.12 million people, or roughly 5% of all jobs that year.
Debt ceiling increase
The new bill would raise the debt ceiling by $5 trillion after Congress reinstated the limit at $36.1 trillion in January. The debt-to-GDP ratio rose to 123% in fiscal year 2024.
As of publication, a previous version of the bill is available from Congress and the final bill will be available at a future date.
Read more on government spending see a breakdown of Trump‘s 2026 budget, and get the data delivered directly to your inbox with our weekly newsletter.

