What kinds of jobs do young people have?
Over half of young people ages 16 to 24 have jobs in the leisure and hospitality, retail, or education and health services industries.
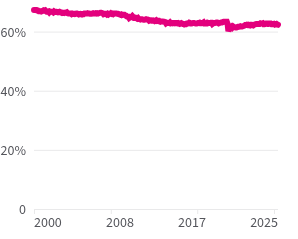
Youth employment, after a period of decline, is picking up. More and more people from the ages of 16 to 24 are working, jumping into roles in leisure and hospitality, and retail.
Youth labor force participation dropped 5.8 percentage points from 2005 to 2015 but increased by 0.6 points from 2015 to 2025. People ages 16 to 19 years, are participating in the workforce at higher rates than teens in years prior, causing a rise in youth employment.
What kinds of jobs are common for young people?
In July 2025, 56.2% of employed young people ages 16 to 24 worked in hospitality, retail, or education and health services industries.
About a quarter of people in this age range had jobs in leisure and hospitality, the highest percentage of young people in any industry. This includes jobs such as amusement park attendants, musicians and singers, fitness trainers, food preparation and servers, cooks in sit-down and fast-food restaurants, hotel and resort clerks, and waiters and waitresses.
Over 40% of working young people have jobs in leisure and hospitality or retail.
Employed people ages 16–24 by industry, July 2025

Another 16.9% of teens and young adults worked in retail jobs such as cashiers, customer service representatives, retail supervisors and managers, retail salespeople, and store clerks and order fillers.
Education and health services employed 14.0% of young people. Jobs in education includes K-12 teachers, teacher’s assistants, and others. Jobs in health services include home health aides, licensed practical and vocational nurses, and medical and health services managers.
The fewest jobs that young people worked were in mining, quarrying, and oil and gas extraction (which includes jobs like supervisors and managers of construction trades, mining and safety engineers, and construction equipment operators) at 45,000. One explanation could be that the Department of Labor does not allow people under the age of 18 to work in any hazardous job, which includes mining.
Curious about where time-honored summer camp counselors fall in the mix? The Bureau of Labor Statistics classifies camp counselors as recreation workers, which is an occupation under multiple industries. Camp counselors seeking employment will earn the highest wages in Alaska, where the hourly mean wage for recreation workers is $22.31.
The BLS uses July data to measure total youth employment (both seasonal summer jobs and jobs held year-round). Why does that matter? Because it can be used to see youth employment trends. It also captures the month the most teens are in workforce, providing a teen employment snapshot lawmakers can use to craft policy.
Do jobs held by young people differ by race or ethnicity?
The racial and ethnic demographics of young workers vary among industries, including the top three that employ high numbers of young people.
Young Black or African American workers had the highest rate of working in leisure and hospitality, at 28.9%. Their white counterparts had the second highest rate (24.9%). Hispanic or Latino youths had a rate of 23.5%, and Asian youths a rate of 22.6%.
Black youths had the highest rate of retail jobs (18.7%), ahead of their Hispanic (17.5%), white (16.7%), and Asian (11.4%) peers.
Young Asian people had the highest rate of employment in education and healthcare services (20.9%) compared to other races and ethnicities. For comparison, 16.8% of Black youths, 13.2% of white youths, and 12.3% of Hispanic youths worked in education and health.
Leisure and hospitality is the most common industry for young people of all races and ethnicities.
Employed people ages 16–24 by industry and percent of race or ethnicity, July 2025

Construction is another field with differences among the groups. Young Hispanic and white people were more likely to work in construction, at rates of 9.1% and 6.8%, respectively. Young Asian and Black people have lower rates, at 2.4% and 3.1%. Construction jobs can include laborers, carpenters, electricians, and construction equipment operators.
There are also differences in professional and business services, government employment (federal, state and local), transportation and utilities, and financial activities. Asian youths are more likely to work in each of these industries compared with other youths, with rates of 11.3%, 8.3%, 7.7% and 7.2% respectively.
Learn more about jobs and unemployment and get the facts every week by signing up for our newsletter.

Keep exploring
- What is the labor force participation rate in the US?
- How many teens are in the labor force? - Of the 167 million people in the nation’s labor force in 2023, approximately 3.81%, or around 6.36 million, were teens.
- Is there a labor shortage in the US? - In December 2023, there were 2.76 million more open jobs than unemployed people.
- Who is Gen Z? Key insights in 4 charts - Members of Gen Z, born between 1997 and 2012, will turn 12–27 years old in 2024. What does the data reveal about this generation?
