What is the Consumer Price Index, and what does it mean for the economy?
The CPI is a key indicator for the state of the economy.
Rising inflation can have a direct impact on the lives of Americans. It means increases in prices at grocery stores, gas stations, and retail shops, making it harder to afford their daily necessities, particularly if wage increases don’t keep up.
Inflation is a phenomenon that can be reported using various measures, the most common of which is the rate of change in a measure called the Consumer Price Index (CPI).
What does the CPI measure?
The CPI, produced by the Bureau of Labor Statistics (BLS), measures changes in the prices paid by urban consumers (who are over 90% of the population) for a particular group of goods and services. The CPI looks specifically at the prices of apparel, education and communications, food and beverages, housing, medical care, recreation, transportation and other items in over 200 categories.
What is the difference between CPI and inflation?
The CPI is reported monthly alongside the “inflation rate,” which, though reported monthly, is a measure of percentage change in the CPI in the last year.
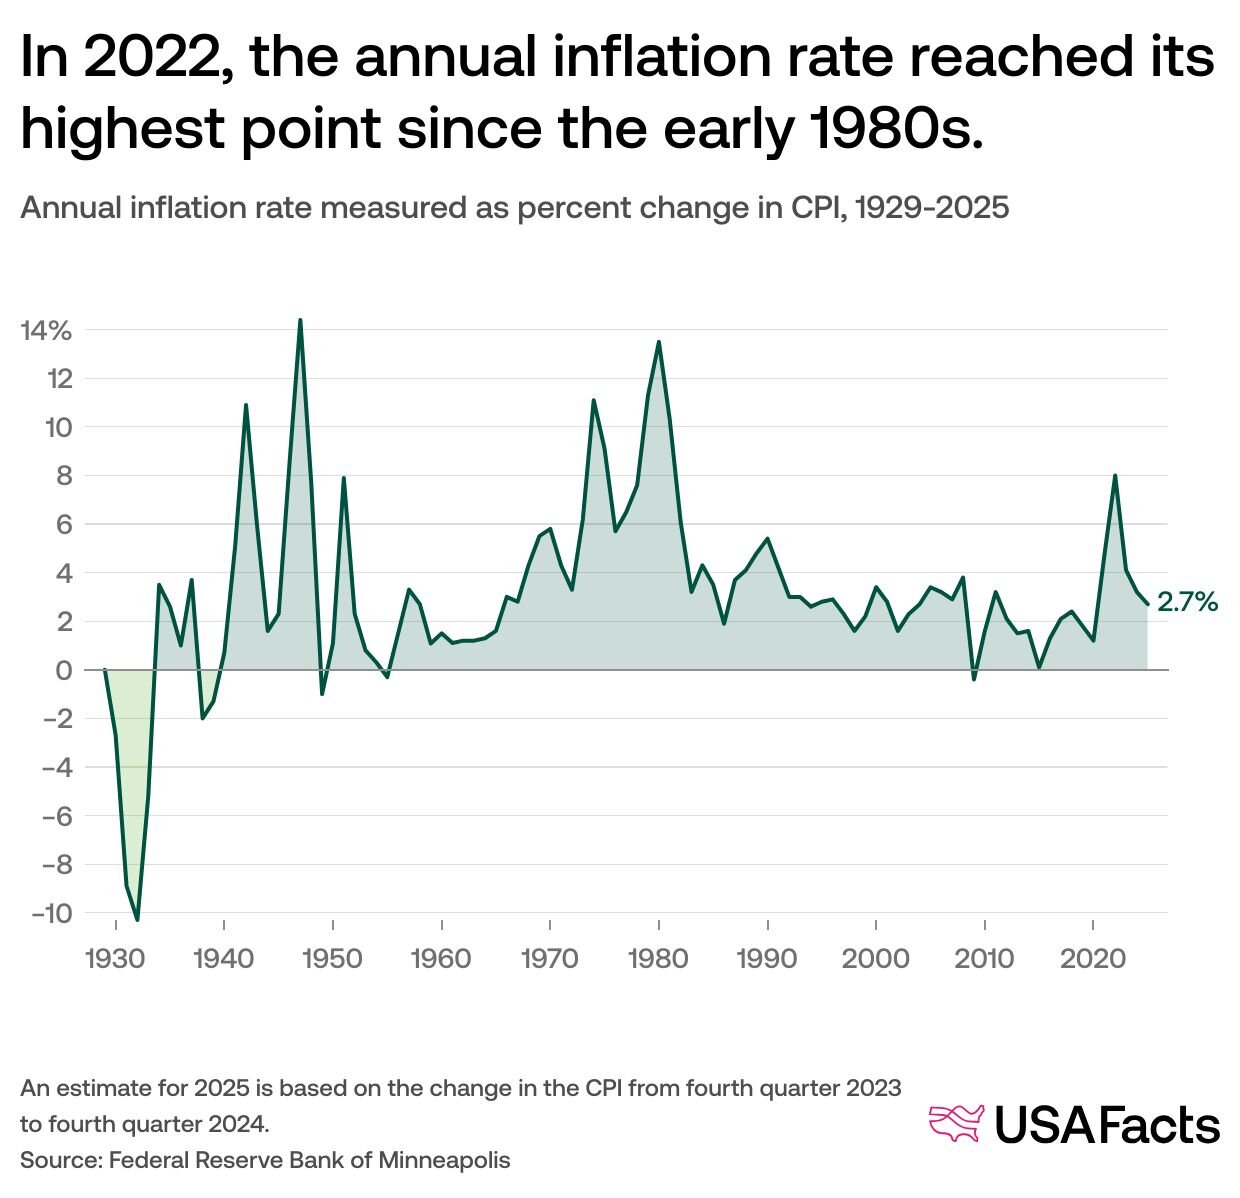
In 2022, the annual inflation rate reached its highest point since the early 1980s.
Annual inflation rate measured as percent change in CPI, 1929-2025
What is a good inflation rate?
The Federal Reserve tracks the CPI closely and has officially targeted a 2% inflation rate since 2012.
Get weekly insights
Subscribe for data-driven insights. No spin, just the facts.
How else is the CPI used?
In addition to being a measure of the health of the economy, the CPI affects income eligibility cutoffs for many government programs — if they’re indexed to inflation, they will rise or fall based on the CPI — as well as the government’s official poverty measure and inflation-indexed tax rates. In 1975, Congress tied the annual increase in Social Security payments to increases in the CPI, which means that the yearly automatic cost of living adjustment is based on this data. Many union contracts also tie wage increases to increases in the CPI.
Find out if wages are keeping up with inflation and get data delivered to your inbox weekly by signing up for our newsletter.
Steve Ballmer explains the history and impact of the Federal Reserve
Keep exploring
- What is inflation and how is it measured? - One of the most common economic indicators helps contextualize how much a dollar can buy.
- Why might prices feel high if inflation is slowing? - Inflation is down, but three in four Americans are still concerned about coming price increases.
- What is the Producer Price Index (PPI)? - The Producer Price Index (PPI) rose 0.9% in June—the largest increase in over three years.
- Are groceries more expensive than last year? - Grocery store food prices increased 2.1% from January 2025 to January 2026 – the product with the biggest jump, ground beef, went up more than 21%.
