Home / Articles / Weekly US Government Data Roundup: March 28, 2023

New data on guns that are used in crimes

Was a gun that was used in a crime bought legally? Who bought it — and where?

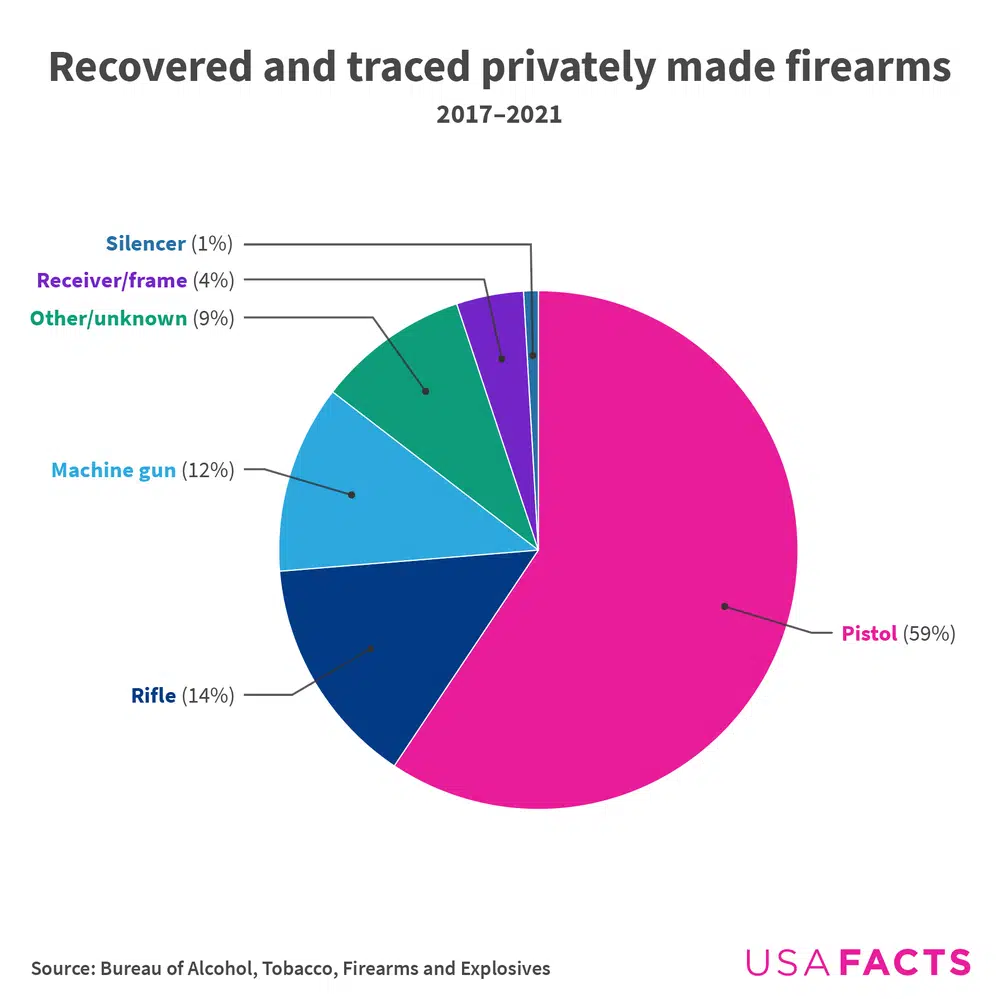
A Bureau of Alcohol, Tobacco, Firearms and Explosives (ATF) report issued just last month can help answer these questions. This report — the first in over two decades — uses 2017–2021 National Tracing Center data to shed light on guns found at crime scenes, ghost guns, and more.

  • The ATF’s National Tracing Center processes thousands of annual requests to help domestic and international law enforcement investigate gun-related crimes. Trace requests increased from 338,000 in 2017 to 460,000 in 2021, up 36%.
Which states had the most traced crime guns
  • Gun trace rates varied widely by state. While California and Texas submitted the highest number of gun trace requests (231,784 and 177,786, respectively), California’s trace rate was 62%. In comparison, Texas had a rate of 83%. 
  • At 85%, Wisconsin traced the highest share of crime guns back to their purchasers. Hawaii had the nation’s lowest rate, 60%, but also submitted the fewest trace requests: 1,194.
  • The uptick in tracking requests reflects the increasing role privately made firearms (sometimes called ghost guns) play in crimes. Privately made firearms that law enforcement submitted to the ATF tripled from 2019 to 2021, from nearly 6,000 to over 19,000.
Recovered and traced ghost guns
  • Pistols were 59% of all privately made firearms that the ATF traced from 2017 to 2021. But they weren’t always this common. In 2017, 35% of all recovered ghost guns were rifles, while pistols comprised 19%. Rifles have since declined as a share of privately made firearms tracked by the ATF, down to 10% in 2021.

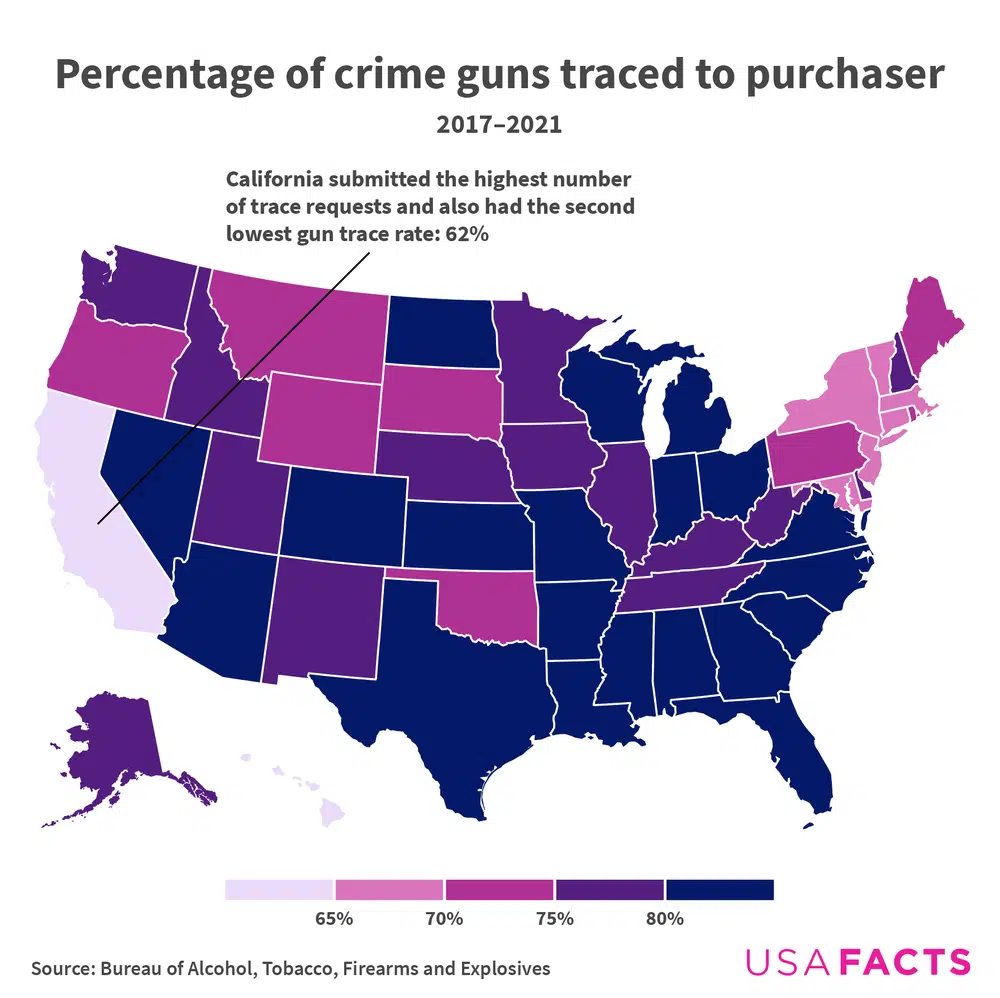
Read on for more about state successes in tracking crime guns. USAFacts is analyzing the ATF report for even more insight. Stay tuned to this newsletter and USAFacts.org for more very soon. 

How diverse is the federal workforce? 

More than 1.5 million civilians work in the federal government. A new report on race, gender, and military service of these employees shows that some races are overrepresented — meaning a disproportionately large number in the workforce compared to their portion of the overall population — while others are underrepresented.

How diverse if the federal workforce?
  • Just over 61% of the federal government workforce identifies as white, but white people are 59.3% of the American population. Just over 18% of the federal government workforce is Black, but Black people are 12.6% of the American population.
  • The workforce is less racially diverse at the senior executive level, with 75.7% of senior federal executives identifying as white. The same goes for genders: over 62% of senior executives are men, while 37.9% are women.
  • Veterans have long made up a large part of the federal workforce. While they’re 5.6% of the US labor force overall, they were 30% of the federal workforce in 2021.

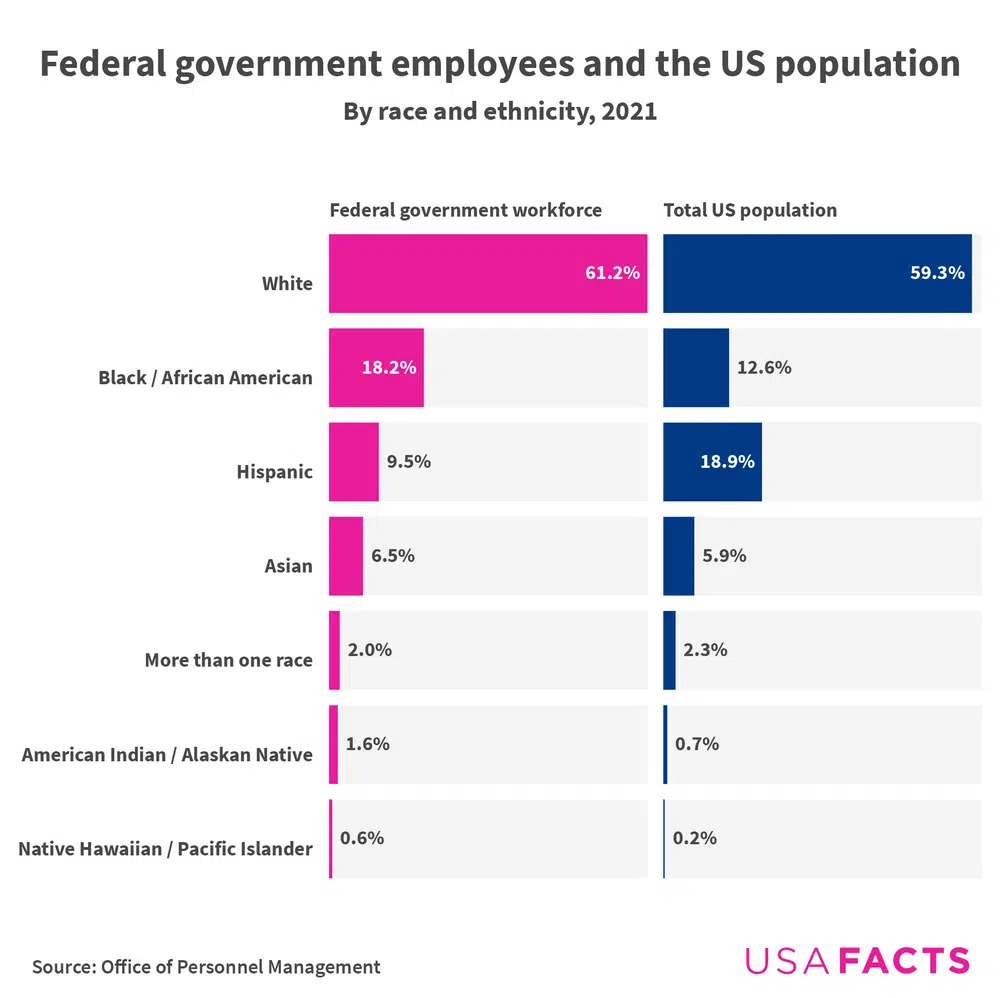
See more charts on the federal workforce here.

Data behind the news

Women coach the two teams set for the NCAA Women’s Final Four (the other two teams will be determined later today). Women are 56.9% of head coaches for NCAA women’s basketball teams.

Think you know the latest data at USAFacts? Test yourself with the weekly fact quiz.

One last fact

SNAP participants through 2021

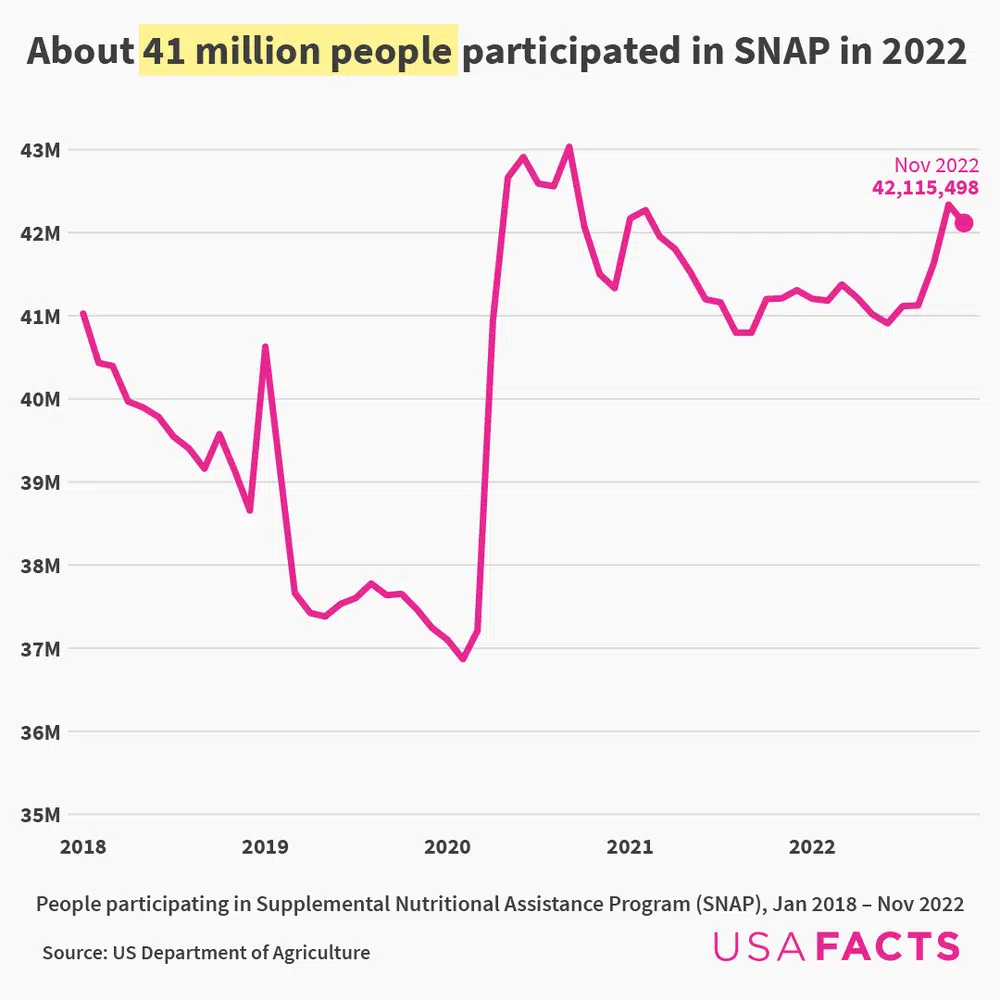
The Supplemental Nutritional Assistance Program (SNAP), also known as food stamps, is the government’s largest program for nutrition benefits. The government added extra SNAP benefits during the pandemic to help families facing food insecurity (the limited or unknown availability of nutritional and safe foods for a household to meet basic needs). These emergency allotments, which affected 41 million Americans on SNAP benefits, officially ended on March 1.