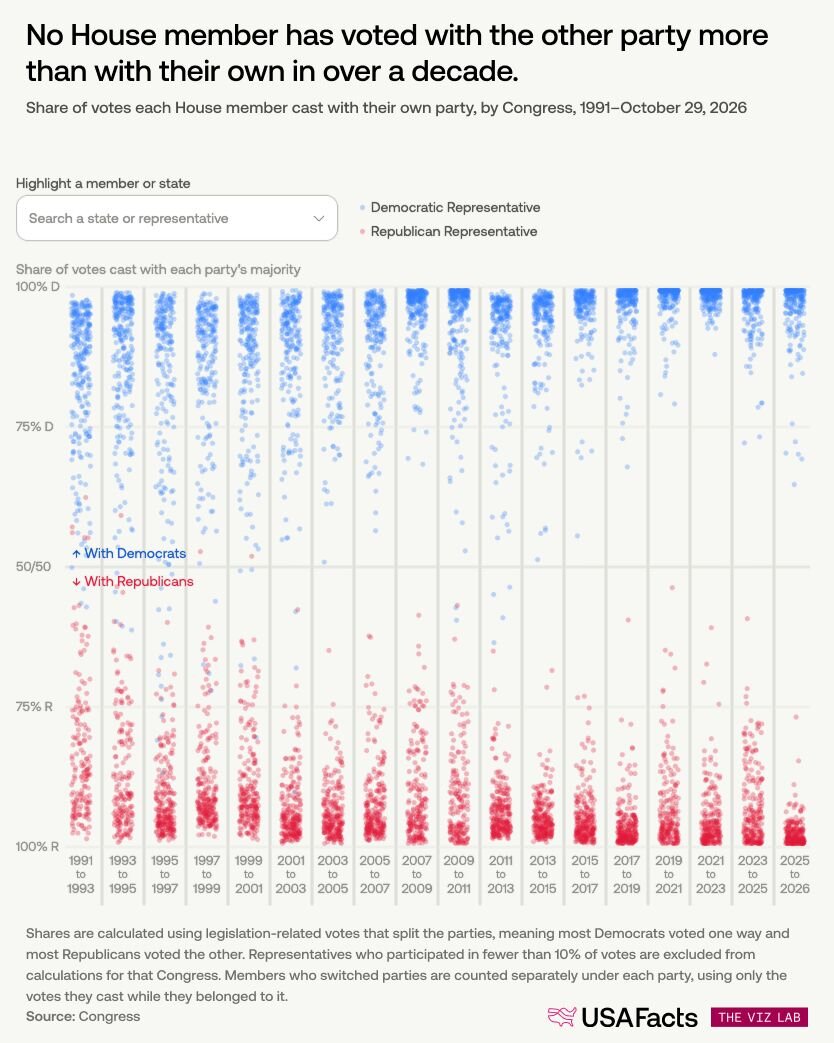
In the current Congress, when the two parties have been split on passing or denying a bill, Democratic Representative Henry Cuellar of Texas has voted with the opposite party 35% of the time. That is more than any other House member. In the Congress that began in 1991, 38 House members crossed party lines at least that often. Nine of them voted with the other party more often than their own.
In 1991, the first full Congress with digitized roll-call data, the typical House member crossed party lines on about 12 out of every 100 votes. Today, it’s fewer than two out of every 100.
No House member has voted with the other party more often than with their own in over a decade.
Share of votes each House member cast with their own party, by Congress, 1991–October 29, 2026
What votes are included in this article?
The Constitution requires the House to keep records of its proceedings. Votes on matters such as electing a Speaker, voting to adjourn, or passing bills and amendments are recorded as roll call votes, which log how each member voted.
This analysis focuses on legislation-related votes that split the parties, meaning most Democrats voted one way and most Republicans voted the other. Find more information about our calculations below.
Get weekly insights
Subscribe for data-driven insights. No spin, just the facts.
Crossing party lines is less common than it used to be
To examine how often House members vote with the opposite party, we calculated each party’s “average crossover rate,” meaning the share of votes on which its members sided with the other party. A lower rate means members voted with their own party more often.
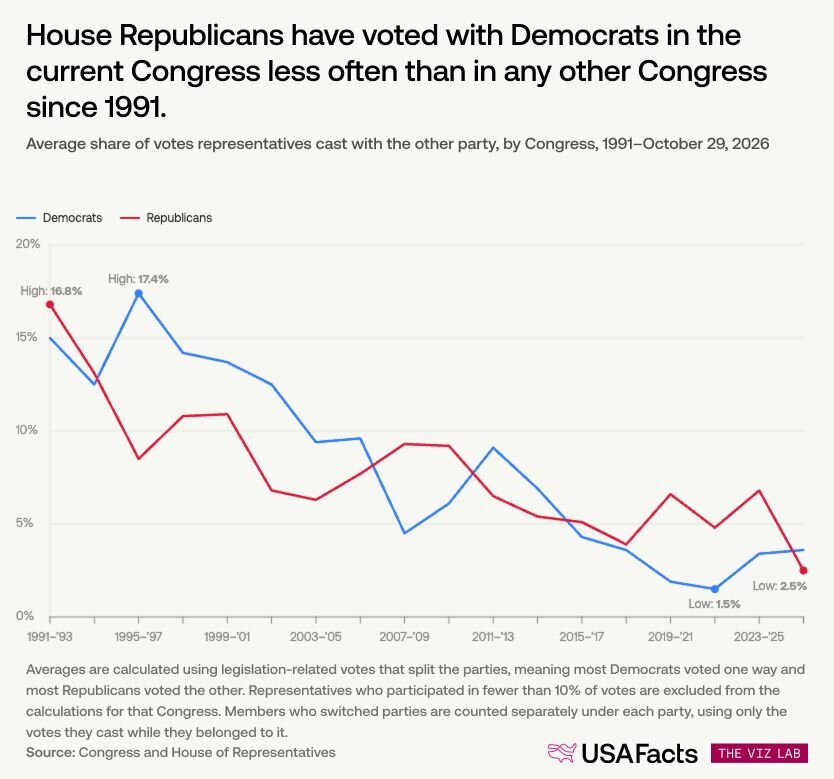
During the 1990s, the average crossover rate was 13.2%, compared with 3.8% over the past decade.
Since 2003, the average crossover rate has been 10% or lower for both parties in Congress. In the current Congress, Democratic representatives voted with the other party on about four out of every 100 votes, while Republicans did on almost three out of every 100. Both parties had their lowest crossover rate in the 2020s. With two months left in the current Congress, House Republicans have their lowest rate yet at 2.5%.
House Republicans have voted with Democrats in the current Congress less often than in any other Congress since 1991.
Average share of votes representatives cast with the other party, by Congress, 1991–October 29, 2026
Explore how crossing party lines varies by policy area
The Congressional Research Service sorts each public bill or resolution into a policy area based on its primary subject. See how often each House member voted with their own party in the current Congress, across the 14 policy areas that include at least five unique bills.
Explore how often representatives voted with their party in the current Congress, by policy area
Share of votes each House member cast with their own party, by policy area, 119th Congress (January 2025–October 29, 2026)

Data Methodology
This analysis covers House roll call votes from the 102nd Congress (1991 to 1992) through the 119th, which is still in progress, so its figures may change. The 102nd is the first Congress for which both years of House roll call records are digitized on Congress.gov.
The analysis includes a vote if it is a recorded roll call on legislation (a bill, resolution, or amendment) and splits the parties, meaning most Democrats voted one way and most Republicans the other.
A party’s position on a vote is whichever way most of its members voted. For example, if 51% of a party’s members who voted said Yes and 49% said No, Yes is that party’s position. Members who voted “present” or didn't vote aren’t counted. If one party’s position is Yes, and the other party’s position is No, it is considered a party-splitting vote. A vote is not party-splitting if a party was exactly tied or if the majorities of both parties voted the same way. Party-splitting votes averaged 611 per Congress in the 1990s and 655 in the past decade.
To be included in this analysis, a member must be a Democrat or Republican and must have participated in at least 10% of a Congress’s party-splitting votes. The analysis excludes delegates from Washington, DC, and the US territories.
A member’s crossover rate is the share of party-splitting votes on which they voted with the other party’s majority instead of their own, across both years of a Congress. If a member switches parties during a Congress, they get a separate crossover rate for each party, calculated only from the votes they cast while in that party. For example, a member who was a Democrat for the first part of a Congress and a Republican for the rest has one rate as a Democrat and one as a Republican. Each party record must meet the 10% participation threshold on its own, so a member who switched may appear once.
A party’s average for a Congress is the mean of its members’ crossover rates. A time-range average is the mean of the Congress averages in the range: the 1990s covers the 102nd to 106th Congresses (1991 to 2000), and the past decade covers the 115th to 119th (2017 to present).
“Typical” refers to the median member across both parties when all are ranked by crossover rate.
