Education
Which states pay teachers the most and least?

Based on data from the Bureau of Labor Statistics (BLS), 14.3 million or 10.8% of US employees were in unions last year. That’s just over half of the 20.1% in 1983, when there were 17.7 million employed, waged, and salaried workers in unions. Notably, while the number of union members declined 321,000 from 2019 to 2020, the percentage of unionized employees increased by half a percentage point. This suggests that most pandemic job losses were in non-union jobs, though it is important to note that the 2020 data is an annual average that includes months from before the pandemic was declared.
Despite the change between 2019 and 2020, BLS data shows long-term declines in union membership in both the private and public sectors, regardless of industry or occupation. In 2000, 20.1% of the 19.2 million people employed in production, transportation, and material moving occupations were unionized.
The union membership rate is higher in the public sector than in the private sector.
While private-sector union membership fell from 9% in 2000 to 6.2% in 2019, it edged up slightly to 6.3% in 2020. Similarly, public-sector membership dropped from 36.9% in 2000 to 33.6% in 2019, then rose to 34.8% in 2020.
There were 7.2 million public-sector union employees and 7.1 million private-sector union employees in 2020. These figures represented a decline of 428,000 in private union sector membership since 2019 and little change in public sector union membership. Public sector union membership increased to 34.8% last year, up 1.2 percentage points from 2019. At 41.7%, local government union membership is the largest segment of the public sector, which includes police officers, firefighters, and teachers.
The number of private-sector union employees dropped 7.6% from 120.7 million in 2019 to 111.5 million in 2020. Unionized private sector employees dropped 5.8% during the same period, from 7.5 million to 7.1 million.
The number of unionized workers in manufacturing fell to a 20-year low of 1.2 million employees, or 8.5% of all manufacturing employees, in 2020. That is down more than half from the 2.8 million union members in 2000. That year, 14.9% of those in the manufacturing industry were unionized.
Among private-sector employees, utilities (20.6%), transportation and warehousing (17%), and telecommunications (14.3%) have the highest unionization rates. By contrast, food services and drinking establishments (1.2%), finance (1.2%), and professional and technical services (1.3%) have the lowest unionization rates.
Workers between 45 to 64 years old are the most likely to be in a union. In 2020, 13.2% of employees between the ages of 45 and 54 were union members, while 13% of those 55 to 64 years old were unionized. Among the four largest racial and ethnic groups in the US, Black employees are most likely to be in a labor union. In 2000, 17.2% of Black Americans were in unions. Though that rate was 12.3% in 2020, it is still higher than the rate of union membership among Americans who identify as white (10.7%), Asian (8.9%), and Hispanic (9.8%).
Previously, men were significantly more likely to be unionized, but the gender gap is closing: 24.7% of men and 14.6% of women belonged to unions in 1983. By 2019, 10.8% of men and 9.7% of women were members of unions.
Between 2019 and 2020, male union members decreased by 368,000, while the number of female union members remained largely unchanged. The union membership rate for women increased to 10.5% up 0.8% from 2019, while the rate for men increased to 11%, slightly higher than 10.8% from 2019.
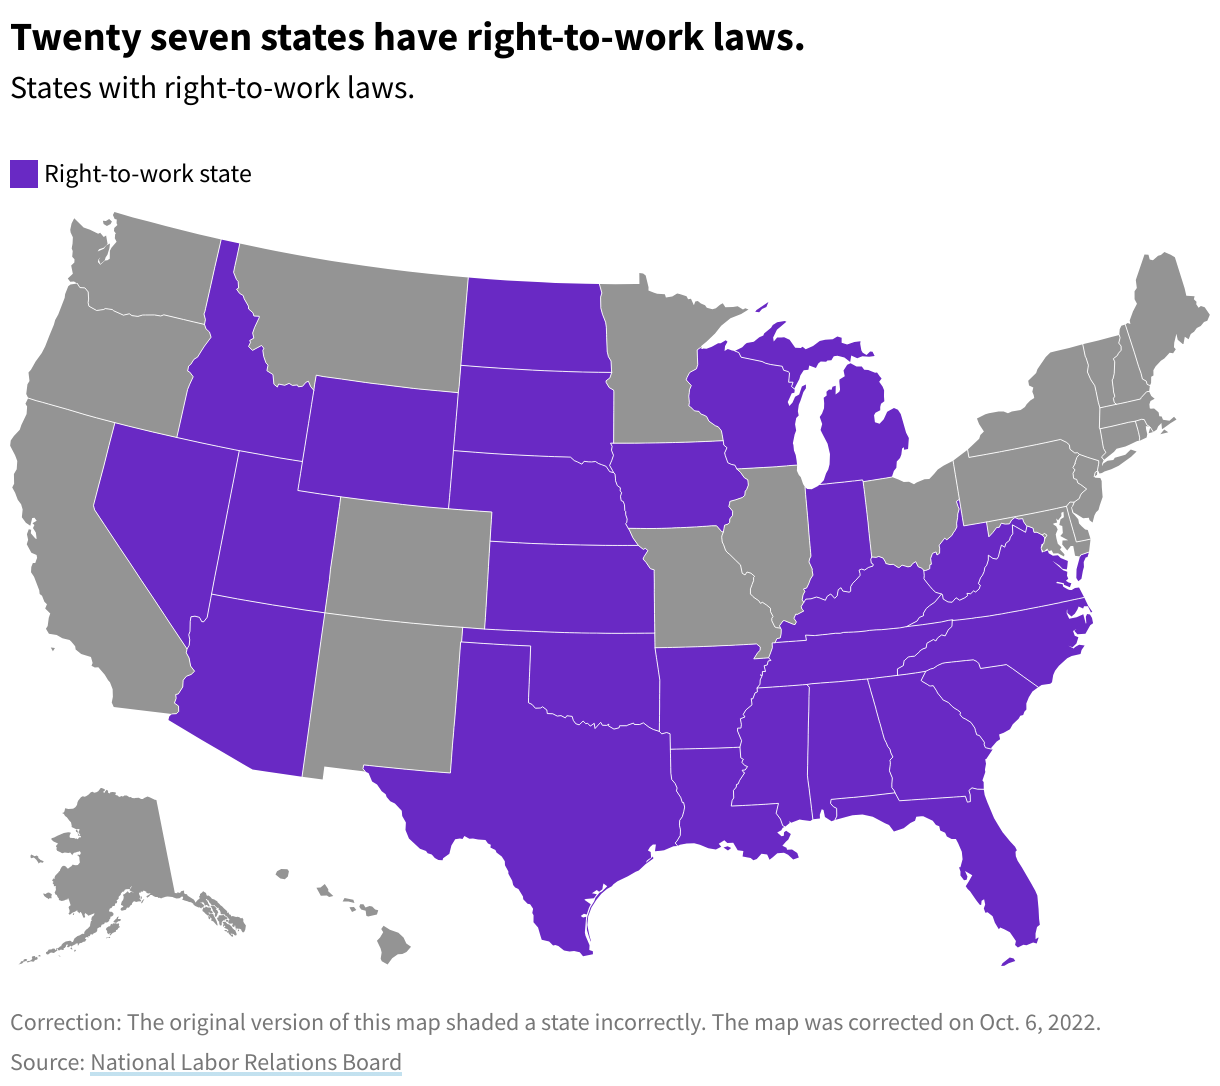
Differences in union membership by state mainly depend on two things: the industries in each state and “right-to-work” laws, which prohibit requiring employees to join unions to get or keep a job. Seven states account for over half of the country’s 14.3 million union memberships: California, New York, Illinois, Pennsylvania, Ohio, Michigan, and New Jersey.
In 2018, the US Supreme Court decided 5-4 in Janus v. AFSCME that public employees aren't required to pay "agency fees" — commonly known as dues — to unions.
The states with the highest union membership — Hawaii (23.7%), New York (22%), and Rhode Island (17.8%) — have no right-to-work laws. States with the lowest union membership rates — South Carolina (2.9%), North Carolina (3.1%), and Utah (3.7%) — have adopted these laws.[1]
Learn more from USAFacts and get the data directly in your inbox by signing up for our newsletter.
Correction: An earlier version of this article showed incorrect union membership rates for North Carolina and Utah. The correct figures were added on Oct. 6, 2022.
Newsletter
Keep up with the latest data and most popular content.