Intro
Immigrants influence many facets of life in the nation, from demographics to the economy. Discover comprehensive data on how immigrants shape the country, the challenges they face, and the impacts of global crises on immigration trends.
Immigration and jobs
Understanding the number of immigrants in the US and the percentage of jobs they hold provides a view of their impact on the labor force.
- Immigrant populationIn 2023, 1 in 7 US residents were immigrants.Source: United States Census Bureau

- Reasons for immigrationIn 2022, 45.3% of immigrants migrated for work-related reasons.Source: US Department of State

- Foreign-born employmentIn 2023, 17.9% of jobs were held by immigrants.Source: US Census Bureau

Immigration channels
A complete view of immigration includes understanding how immigrants come to the US via authorized pathways like visas and green cards as well as attempted unauthorized routes.
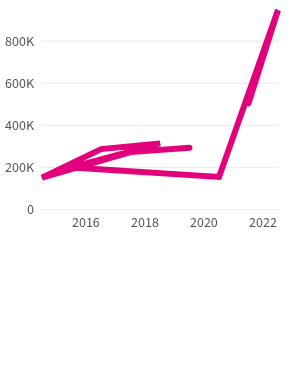
- Authorized immigrationIn 2022, about 2.6 million people immigrated to the US via authorized channels.Source: US Department of Homeland Security & 1 more

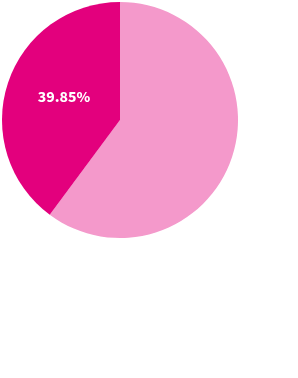
- Immigrant originsIn 2022, 39.9% of immigrants came from Mexico and India.Source: US Department of Homeland Security & 1 more
- Unauthorized immigrationIn 2022, an estimated 11 million unauthorized immigrants lived in the US.Source: US Department of Homeland Security

Immigration and international conflict
Data on the number of refugees and asylum seekers coming to the US each year highlights how global crises influence immigration patterns.