Population
The nation’s natural rate of population growth (meaning births minus deaths) has slowed in recent years. Population growth in the US is now due just as equally to natural growth as it is to net migration (people coming to the country minus people leaving). Our Annual Report from April 2019 has more on this trend.
People immigrating to the US constitutes more and more of our population growth, so we wanted to understand more about the demographics of non-citizens and naturalized citizens. The Annual Report also revealed several other changes that occurred over the past 30 years: household sizes have decreased, the nation is more racially diverse, the population is getting older and more educated. How are these shifts reflected in non-citizens and naturalized citizens, as well as native-born Americans?
As of 2018, the foreign-born population comprises 14% of the US population, compared to 6% in 1980. Between 2012 and 2018, naturalized citizens (people born as non-citizens who have acquired American citizenship) grew from 6% to 7% of the total population. Although both the number of non-citizens and native-born people fell (by 0.3 and 0.7 percentage points, respectively) the nation experienced a net increase in the foreign-born population: from 13% to 13.7%.
Demographics like race/ethnicity, age, and gender have remained the same for all three of these resident status groups from 2012 and 2018. Comparing these groups, however, illustrates notable differences in demographic characteristics.
Native born residents are predominantly non-Hispanic white people. Compared to the total population, Hispanic and Asian populations are highly represented in both naturalized citizens and non-citizen groups. Men and women are nearly equally represented between native-born citizens and non-citizens. Naturalized citizens, however, tend to be more female (54% versus 46% male).
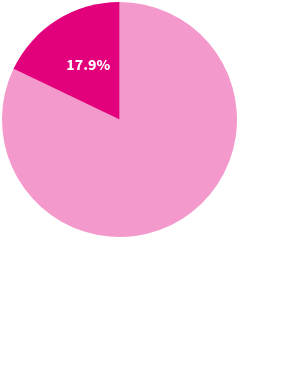
Forty-six percent of non-citizens are between the ages of 25 to 44. Naturalized citizens are generally older with 65% at 45 years or older. Native-born citizens are generally younger with 35% of native-born citizens being 24 or younger, relative to 7% of naturalized citizens and 18% of non-citizens.
Both household and family size have been shrinking since 2012 for the total population, but they have fallen most dramatically for non-citizens. Even still, non-citizens still live in larger households and have larger families than both naturalized citizens and native-born citizens.
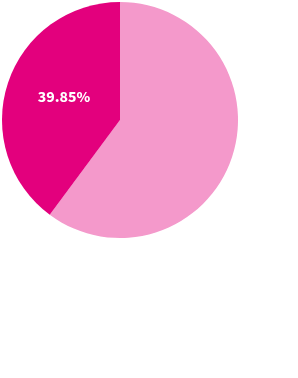
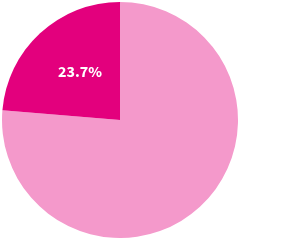
Non-citizens are less likely than other groups to finish high school. Just 8% of native-born citizens haven’t finished high school, as opposed to 36% of non-citizens. On the other end of educational attainment, naturalized citizens are the most likely to have attained a higher degree. Thirty-six percent of naturalized citizens have attained a bachelor’s degree or higher compared to 33% of native-born citizens and 29% of non-citizens. Even though non-citizens lag citizens in attainment of bachelor’s degrees graduate or professional degrees, the proportion with these degrees is increasing faster than among citizens (by 2 and 2.8 percentage points, respectively).
Across all resident status groups, more households are receiving Social Security while fewer are receiving food stamps (also known as SNAP).
Broken out by resident status groups, however, the type of income households receive differs. Ninety-one percent of non-citizen households have earnings relative to 77.5% of native-born citizen households. And only 3.5% of non-citizen households have retirement income, while 21% of native-born citizens do.
Median household income has grown by $5,943 while median earnings has only increased by $2,422 in real terms.
Non-citizens have lower median earnings than citizens, with women consistently earning less than men since at least 2012, the same as the overall population. Median incomes have generally grown for most groups in this time period, except for one: native-born males. Male naturalized citizens now have a higher median earnings in 2018 ($55,004) than male native-born citizens ($54,808), the second year in a row this has been true.
Even though median earnings for male native-born citizens decreased, median household income for native-born citizens increased in real terms between 2012 and 2018. Naturalized citizens and non-citizens both saw a larger increase in median household income with naturalized citizens having the highest median household income in 2018 among the three groups at $68,594.
As the US population becomes increasingly foreign-born, it’s important to understand how native-born citizens, naturalized citizens, and non-citizens differ. Demographic shifts in the country reflect the demographic characteristics of the sub-populations that are growing as a proportion of our population. For more information on other topics related to immigration, check out our timeline of immigration policy or where asylum seekers are coming from.
The American Community Survey (ACS), an ongoing monthly survey by the US Census Bureau that is the source of the data in this article, has two measures of income: household income and earnings. The definitions of these measures are slightly different, and understanding that nuance can help untangle some counterintuitive results. The Census Bureau has a great explanation of how and why these measures differ, but essentially, it boils down to this: earnings includes just wages, salaries, and self-employment income for individual workers. Household income includes more sources of income than salaries. It includes Social Security, interest, and dividends (and more) in addition to all those salaries. Additionally, the “typical” full-time, year-round worker is usually a member of a higher income household.
The implication of this nuance is that these metrics can move in different directions without being in conflict. It’s just a way to provide a more detailed picture of the standard of living in the US.
Learn more from USAFacts and get the data directly in your inbox by signing up for our newsletter.
Population
Population
Population
Population
Newsletter
Keep up with the latest data and most popular content.