Health
US obesity rates have tripled over the last 60 years

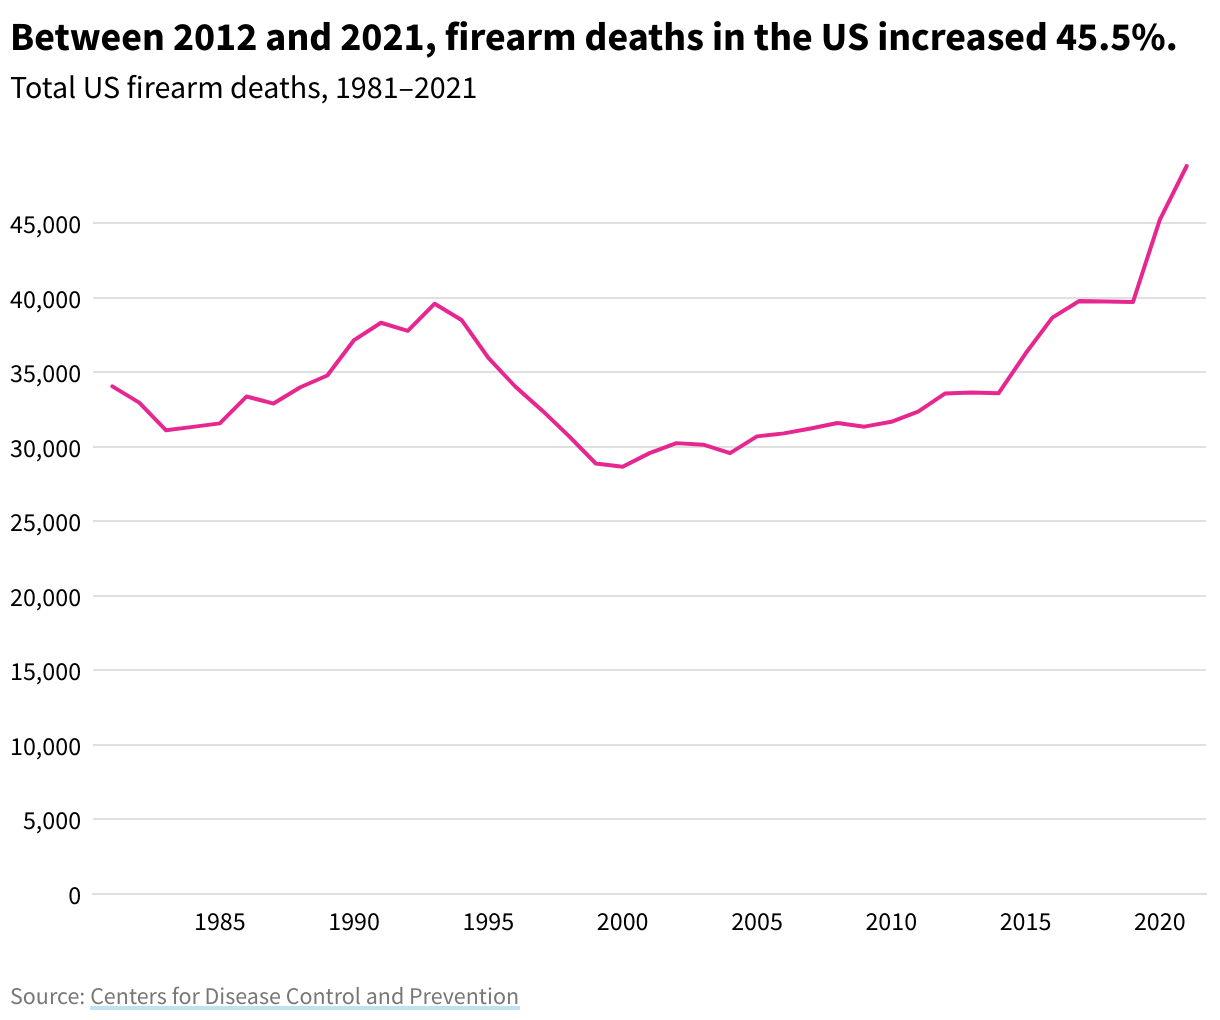
The number of people dying from firearm-related incidents has been increasing since 2000 — in particular, deaths increased by 45.5% between 2012 and 2021, with a spike between 2019 and 2021. There were 48,830 firearms deaths in 2021, the highest total number since the Centers for Disease Control and Prevention (CDC) began tracking this statistic in 1968. This is a 70% increase from 2000, when there were 28,663 firearm deaths.
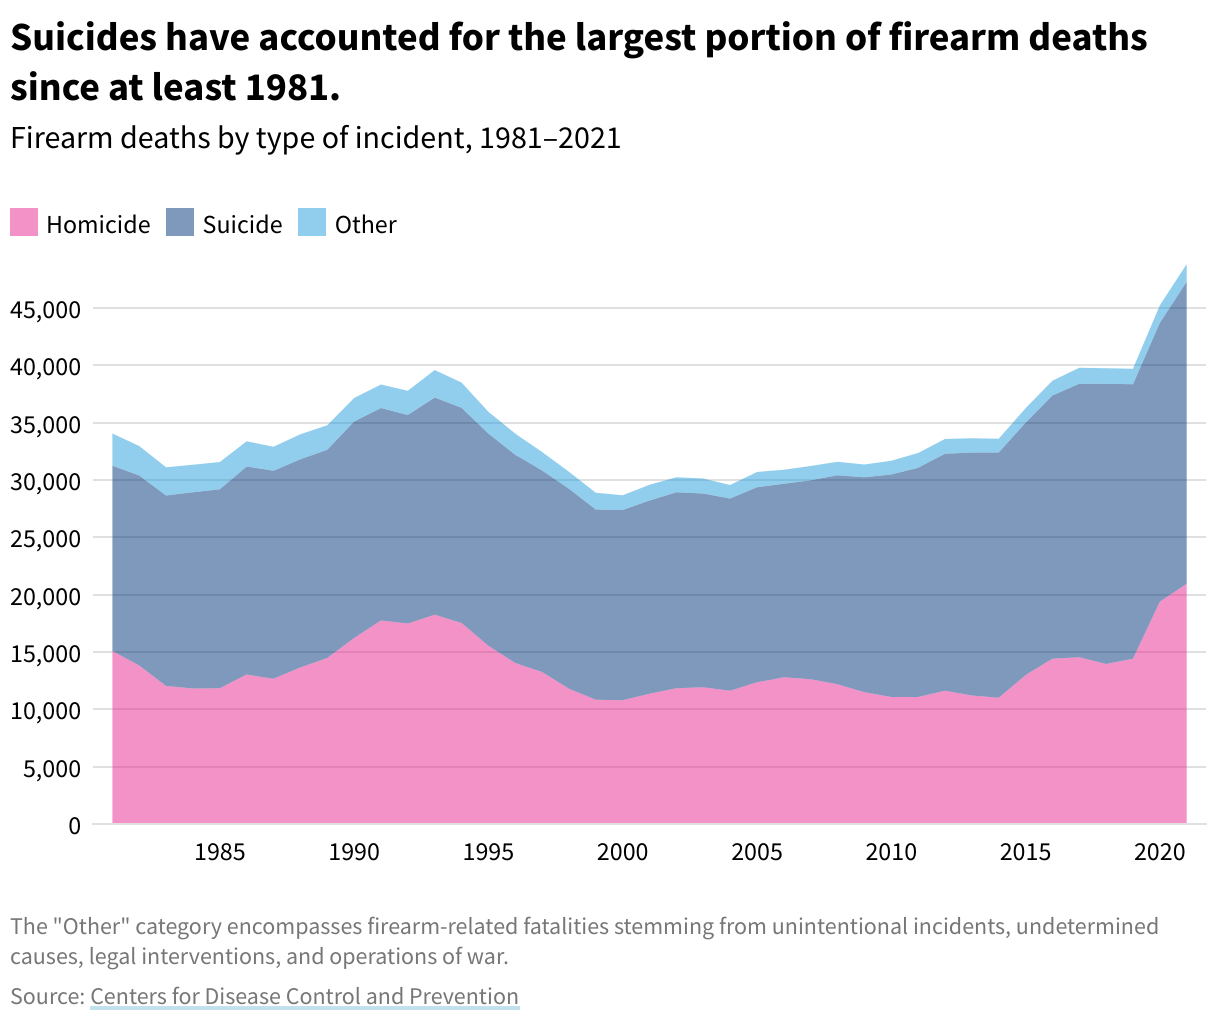
CDC data divides firearm deaths into five categories:
Most firearm deaths in a given year are suicides — 2021’s 26,328 firearm-related suicides account for 54% of all firearm deaths for that year. The second-most common is homicide, which accounted for 20,958 of firearm deaths in 2021.
Age intersects with these trends: people under 40 are more likely to be victims of homicide, while firearm deaths among those aged 40 and up are more often suicides. Across all types, the greatest number of victims are between 20 and 34 years old, a trend that has remained consistent for decades. In 2021, they accounted for 17,483 of the 48,830 firearm-related deaths, or 36% of the total.
All the other categories — unintentional, legal intervention/operations of war, and undetermined — accounted for less than 600 deaths each. And unintentional firearm deaths actually decreased, from 1,871 in 1981 to 549 in 2021.
Comparing firearm death data by age, race, and gender shows that not all groups are impacted equally by gun deaths. Among those breakdowns, younger adults, Black or African American people, and women make up the largest shares of deaths from firearms.
The highest number of firearm deaths occur in the 20–34 years age group, a trend that has sustained for decades.
While the number of people dying by firearms increased for all age groups from 2020 to 2021, more 20–34 year olds died from firearm deaths than any other age group. They accounted for 17,483 of the 48,830 firearm-related deaths in 2021, or 36%.
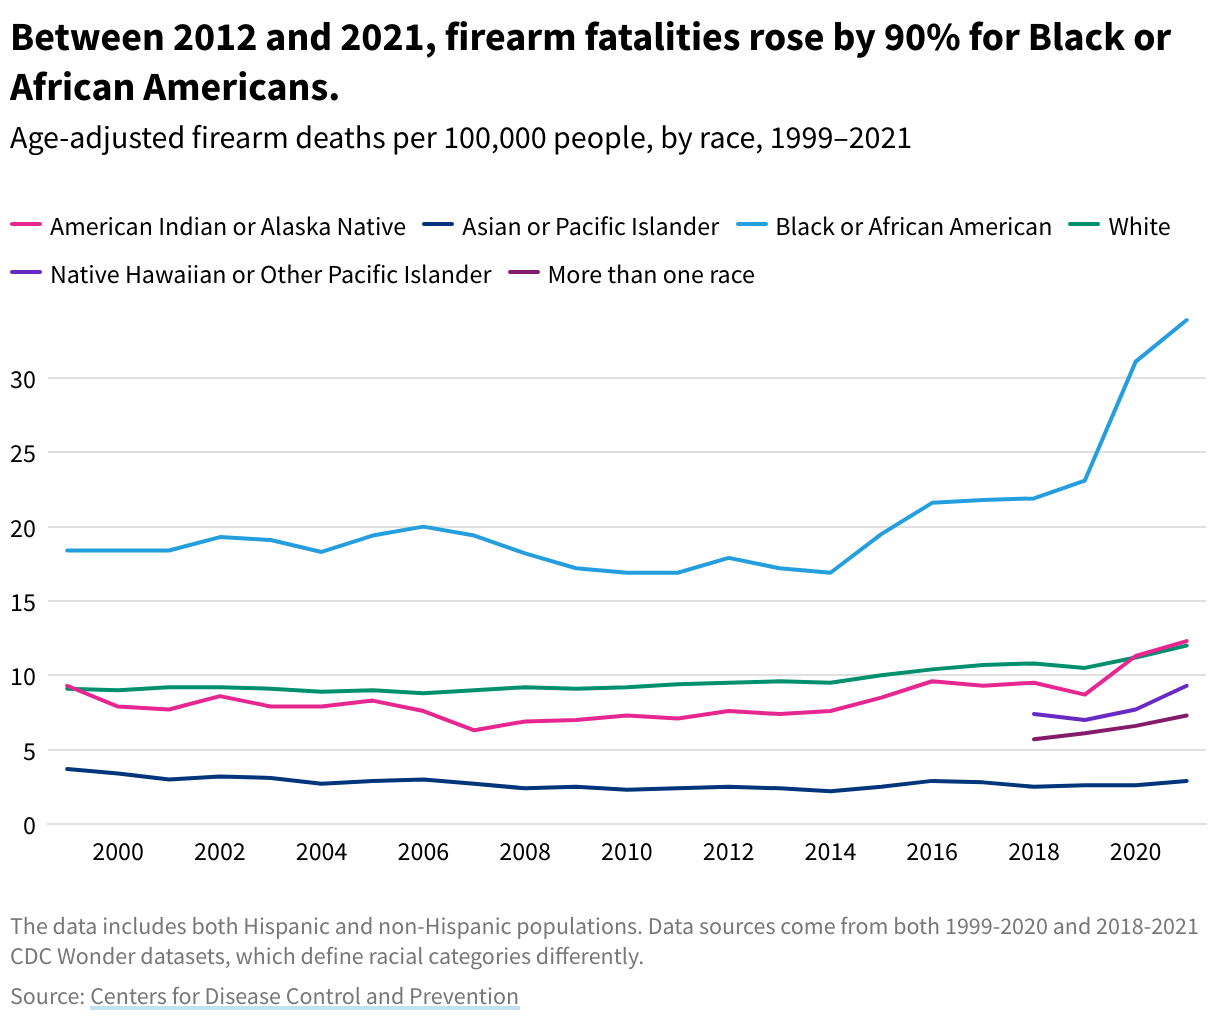
Twice as many white people died (29,663) in firearm incidents in 2020 compared to Black or African American people (14,311), a ratio that has been consistent over time. However, when adjusting for population size, the annual age-adjusted death rate was 12.0 per 100,0000 white people and 33.9 per 100,000 Black people.
The rate was 12.3 for American Indian and Alaska Natives, 9.3 for Native Hawaiian or Other Pacific Islanders, 7.3 for people of multiple races, and 2.9 for Asian or Pacific Islanders.
In 2021, six times more men than women died in firearm-related incidents: 41,866 vs. 6,964.
The number of women victims has increased minimally over time: 5,707 in 1981, 6,964 in 2021 Men saw a much more drastic increase, from 28,343 in to 41,866 by 2021.
Texas, California, and Florida — the three most populous states — recorded the most firearm deaths in 2021, at 4,613, 3,576, and 3,142, respectively. California had been consistently recording the highest number of firearm deaths, but in 2015, the number in Texas surpassed California.
Rhode Island, with a population is about 30 times smaller than Texas, recorded the lowest number of firearm deaths at 64. Ultimately, Texas’s number of firearm deaths for 2021 was about 2.5 times the number of Rhode Island’s, when accounting for population differences.
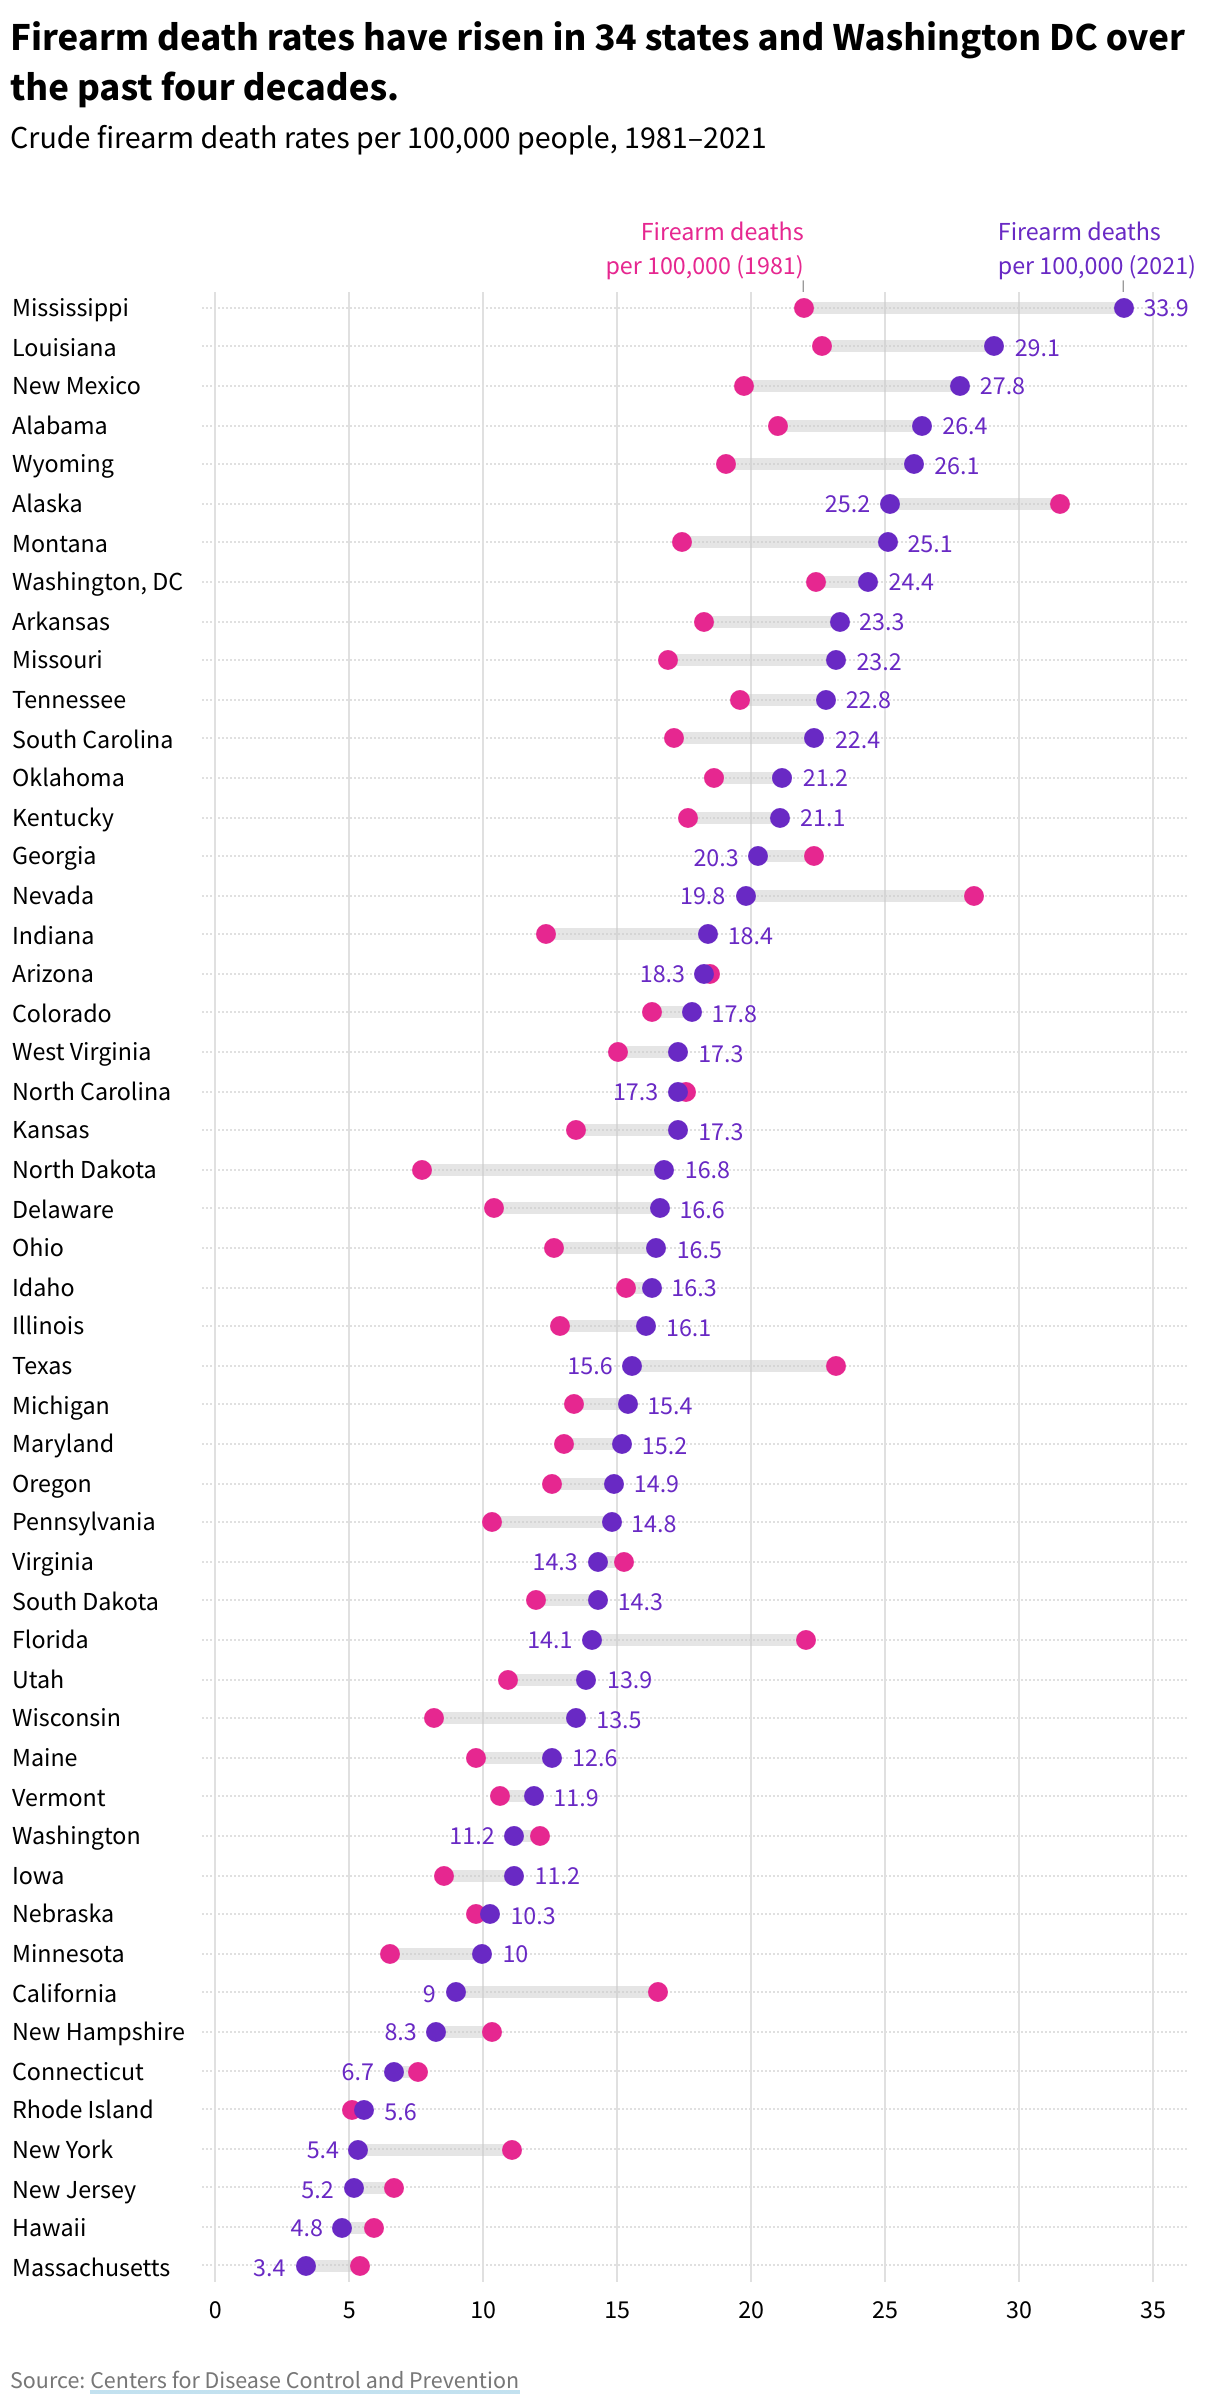
Population size doesn’t tell the whole story — death rates per 100,000 people don’t necessarily correlate with population. The states with the highest firearm death rates in 2021 were in the south and southwest:. Mississippi had 33.9 firearm deaths per 100,000 people, Louisiana had 29.1, and New Mexico had 27.8. The lowest rates were in Massachusetts (3.4), Hawaii (4.8), and New Jersey (5.2).
Firearm deaths increased over the last decade in all states except New Jersey, where annual firearm deaths dropped from 482 in 2011 to 475 in 2021, and in Massachusetts, where they dropped from 254 in 2011 to 247 in 2021.
The CDC WONDER database collects data from death certificates to track population, mortality, and underlying cause of death for residents in all counties in the US. The WISQARS Fatal Injury Data Visualization tool, provided by the CDC, uses data from the National Vital Statistics System operated by the National Center for Health Statistics. It collects death count data and demographic data, and specifically tracks injury-related deaths.
Learn more about the statistics behind firearm deaths in the US, firearm deaths from suicide, and gun-related homicides, and get the data directly in your inbox by signing up for our email newsletter.