How has wealth distribution in the US changed over time?
The highest-earning Americans have increased their share of wealth over the past three decades, while the middle class has been losing its share.
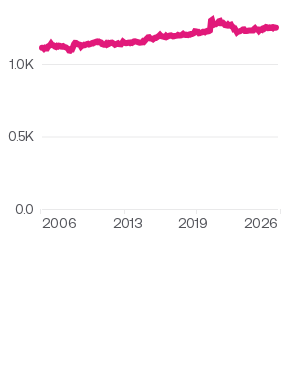
The top 20% income quintile held about 71% of US wealth at the end of 2022, or about $97.9 trillion.
Share of wealth by income percentile

The highest-earning 20% of Americans have seen their share of wealth grow over the past three decades, while those who earn less saw their share decline, according to data from the Federal Reserve.
Get weekly insights
Subscribe for data-driven insights. No spin, just the facts.
What is wealth?
Wealth is the value of one’s assets owned minus the debts they owe. As a result, wealth can be negative.
Assets include cash in a savings or checking account, stocks and mutual fund shares, equity in a home or other real estate, vehicles, and retirement accounts such as an IRA or 401K, among other assets. Debts include credit card bills, hospital bills, bank loans, student loans, or an outstanding mortgage balance.
Whose wealth has grown the most?
The top 20% of Americans by income have seen their share of wealth increase the most between 1990 and 2022. In the final quarter of 2022, this group held 71% of the nation’s wealth – up from 61% in 1990.
The highest-earning 1% of Americans drove this growth: at the end of 2022, their share of the country’s wealth grew to 26% from 17% in 1990 — nine percentage points. Across those 32 years, the rest of the top quintile saw their share of wealth grow to 45% from 44% — a one percentage point gain.
According to USAFacts calculations using data from the Internal Revenue Service and Census Bureau, the total market income for the top 1% averaged $3.4 million in 2021.
Comparatively, the bottom 20% have seen their share of wealth remain at around 3% over the past three decades.
How has the wealth of the American middle class changed?
The 60% of income earners between the top and bottom quintiles — commonly referred to as America’s middle class — have seen their share of wealth diminish since 1990. Over the past three decades, this group’s share of total wealth fell to 26% from 37%.

How much wealth is there in America?
Americans held roughly $137.6 trillion in wealth in 2022, according to the Federal Reserve.
For the top 20%, that equaled about $97.9 trillion. The middle class combined held $35.7 trillion. And the bottom quintile had $4.1 trillion in total wealth.
The top 1% held $35.8 trillion in wealth, more than eight times those in the poorest quintile.
Which generation owns the most wealth?
Baby boomers have the highest household net worth of any US generation.
Defined by the Federal Reserve as being born between 1946 and 1964 (currently in the ages between 59 and 77), baby boomers are in often in the sunset of their career or early into retirement.
Their higher net worth is expected: with most baby boomers financially planning for at least a few more decades, they benefit from wealth earned from long careers and have more robust retirement accounts than the silent generation, who have dipped further into retirement savings.
The silent generation (born before 1946) has the second-highest net worth (or assets minus liabilities) at around $1.29 million per household, followed by Generation X (born between 1965 and 1980) at $1.11 million per household. Millennials (born after 1980) are the generation with the least wealth. (The Federal Reserve does not have data on Generation Z yet.)
Baby boomers have the highest net worth per household.
Net worth per household by generation, Q3 2022

Which generation holds the most assets?
Baby boomers also have the most assets per household, followed by the silent generation, Generation X, and millennials. As for asset components, baby boomers have the most in retirement savings, as many people of the generation have not yet retired or been retired for very long. They also have slightly more than the silent generation in stocks and real estate.
Generation X and millennials are still building their wealth. Millennials in particular have little wealth in stocks and mutual funds, averaging around $18,000 per household. Many also do not own real estate, an asset area traditionally used to build wealth.
Baby boomers have the most in assets, with fuller retirement funds and more wealth in stocks and real estate.
Assets per household by generation by category, Q3 2022

What generation holds the most liabilities?
Generation X has fewer assets than boomers and the silent generation — and they also have the highest average liabilities. Generation X households have an average of $146,000 in unpaid mortgages. In fact, home mortgages are the biggest component of Generation X liabilities, indicating that many may be recent homeowners who still have a decade or longer before their homes are paid off.
Gen X holds the most in liabilities, despite holding fewer assets than baby boomers and the silent generation.
Liabilities per household by generation by category, Q3 2022

Millennials have the second-highest in liabilities per household, followed by baby boomers and the silent generation. These trends will likely shift as millennials grow in their careers and Generation X begins to retire.
Are Americans saving as much as they used to? Get the latest data delivered to your inbox weekly by signing up for our newsletter.
Keep exploring
- Who owns American wealth? - As of 2023, the top 1% of American households owned 30 cents of every dollar.
- How much wealth does the American middle class have?
- What percentage of Americans own stock? - In 2019, 53% of families were invested in the stock market.
- Americans aren't saving as much as they used to - Americans saved more disposable income during the pandemic, but people are still saving less than they did in the 1960s and ’70s on average.
