Does access to healthcare differ by race and ethnicity?
Adults in four groups — American Indian and Alaska Native, Black, Native Hawaiian or other Pacific Islander, and Hispanic — report higher rates of fair or poor health than the national average.
Across several measures of health and access to healthcare, American Indian and Alaska Native, Black, and Hispanic adults often fare worse than other racial or ethnic identities.
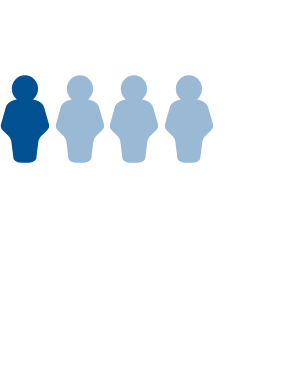
In 2024, about 14.8% of Americans were in fair or poor health. Zooming in on demographics reveals disparities between racial and ethnic groups. Adults in four groups — American Indian and Alaska Native, Black, Native Hawaiian or other Pacific Islander, and Hispanic — report higher rates of fair or poor health than the national average.
Data from the National Center for Health Statistics (NCHS) shows notable differences in specific health conditions and life expectancy by race or ethnicity.
American Indians or Alaska Native adults had the highest rates of diabetes (13.6% of the group’s population) and depression (9.4%). Native Hawaiian and Pacific Islander people have the highest rate of asthma: 13.3%. The rate of hypertension, often referred to as high blood pressure, is highest in Black adults, at 34.5%. Cancer and heart disease are the most common among white adults at 13.6% and 6.0%.
In 2022, American Indian and Alaska Native adults had the lowest life expectancy at 67.8 years. Black Americans had the second lowest: 72.8 years. Asian adults had the longest life expectancy at 84.4 years.
Which groups have difficulty affording healthcare?
About 15.0% of Native Hawaiian/Pacific Islander adults didn’t get necessary medical care due to cost, the highest for any racial or ethnic group. In comparison, about 3.7% of Asian adults didn’t get necessary healthcare for cost reasons, the lowest level of any group.
There are also differences when it comes to affording prescriptions. For example, 19.1% of Native Hawaiian/Pacific Islander and 10.0% of Black adults did not take prescription medicine as prescribed to save money. This could include taking lower doses or taking medication at wider intervals.
Does health insurance coverage differ between racial groups?
In 2024, 29.0% of people who identified as American Indian or Alaskan Native did not have health insurance. The same was true for 25.3% of Hispanic people. Although coverage rates for both of these groups have been rising since 2019, they have had a consistently higher uninsured rate than other groups.
Many uninsured adults have been without health insurance for extended periods. Two out of every three uninsured adults have been uninsured for more than one year. For Hispanic adults, it is three of every four.
How does the ability to take sick days impact healthcare access?
Taking time off work to see a doctor or get needed medical care is a necessary part of healthcare access. Having paid sick leave can help workers take time for healthcare needs. After all, if someone needs surgery, it's not uncommon to need days, or even weeks, of recovery time.
Among workers, 60.6% of Hispanic adults had access to paid sick leave, the lowest of any race or ethnicity group. On the other end, 78.6% of Asian wage workers could take paid sick leave.
Do racial and ethnic groups differ in how they get healthcare?
According to the Centers for Disease Control and Prevention (CDC), preventative care can have profound impacts on health outcomes and life expectancy. How frequently people get this care differs greatly by race and ethnicity.
When asked about places and care received in the past 12 months, Native Hawaiian or Pacific Islander adults have the lowest rates in having a usual place of care (78.2%), a doctor visit in the past 12 months (73.7%) and a flu shot (30.6%).
Hispanic adults also have comparatively lower levels of care, with 81.9% receiving treatment from a usual place of care, 77.7% having a doctor’s visit in the last year, and 33.5% getting a flu shot.
White adults have the highest rate of having a usual place of care (90.9%) and a doctor visit in the past 12 months (87.4%). More than half of Asian adults had a flu vaccine in the past 12 months, the highest among racial or ethnic groups.
Learn about how cost can impact the types of healthcare people seek, who has health insurance, and get data delivered to your inbox weekly by signing up for our newsletter.

