Analyst Notes: Why party registration is hard to track
Reconciling 31 different ways to report the number of registered Democrats, Republicans, and unaffiliated voters.
Want to know how many registered Democrats, Republicans, and unaffiliated voters there are in the United States? You might assume that someone in the government has that number aggregated, organized, and ready to use. They don't. At least not in a single publicly available place.
Like my colleague Chris found when he went looking for whoever decides how red or blue a state is, some of the most basic-sounding political questions don't have an official answer.
Voter registration in the United States happens entirely at the state level. Sometimes data collected at the state level gets aggregated and shared by the federal government — think crime statistics reported to the FBI, or causes of death aggregated by the CDC — but not always. Party affiliation data is in the “but not always” camp.
Not every state even requires voters to declare a party when they register; only 30 states and DC do. And that data lives in 31 different places on the internet in 31 different formats.
Bringing it all together may sound like a slog, and it kind of was. But I find a lot of joy in wrangling disparate data into one usable resource, enough that I keep picking up projects like this one (please see exhibits A and B for further evidence).
Once you have the data all in one place, you start to see trends — like how the party affiliation has changed in each US county over the past decade.
The share of voters registered outside the two major parties grew in three out of four counties over the past decade
Percentage point change in the share of voters registered with a minor party or no party, 2016–2026
The share of Republican party registrants increased in 77% of counties nationwide
Percentage point change in the share of voters registered with the Republican party, 2016–2026
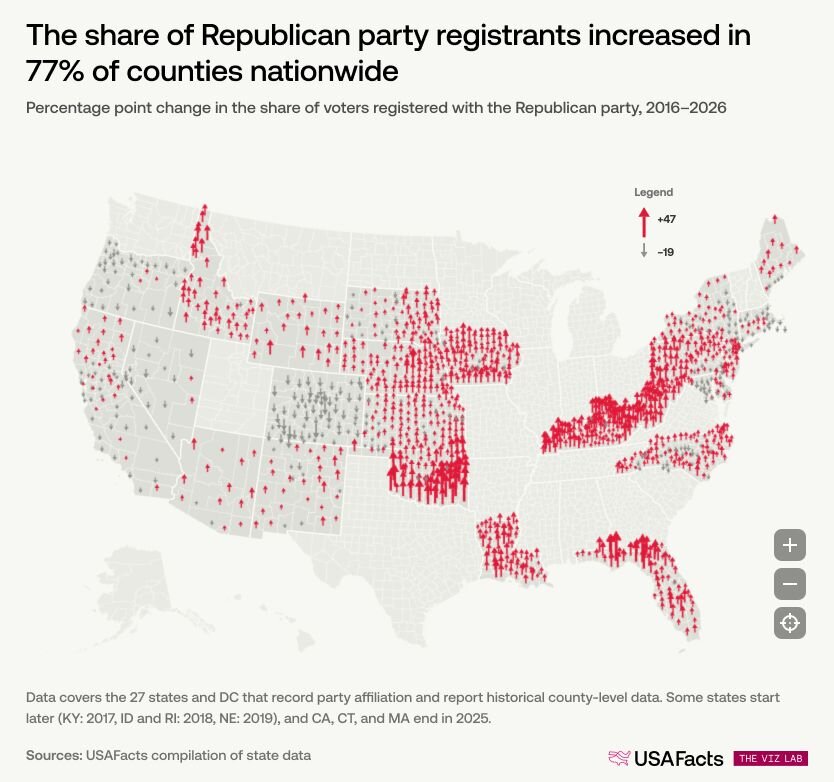
The share of Democratic party registrants decreased in 93% of counties nationwide
Percentage point change in the share of voters registered with the Democratic party, 2016–2026
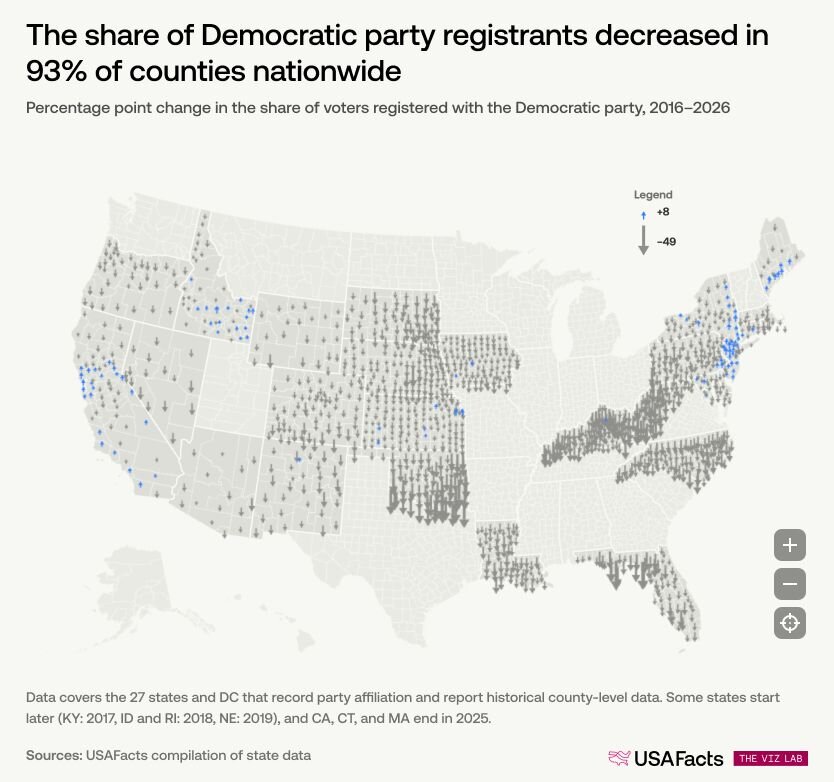
If you just want the findings, you can read the full piece. But if you want to know how I pulled this together, keep reading.
Collecting the data
Each of the 30 states (and DC) that track registrants’ party affiliation publishes its data separately, in whatever format works for them. Before I could think about national trends, I had to find the data.
Some states made it straightforward and provided a downloadable Excel or CSV file, updated regularly, right on the Secretary of State's website. Others displayed their data in online dashboards or HTML tables that weren't designed to be exported, making it much more difficult to work with the data. And some only offered PDFs, a notoriously tricky format for computers to parse.
Get weekly insights
Subscribe for data-driven insights. No spin, just the facts.
Things got even more complicated when I decided to incorporate party affiliation data dating back to 2016. Tracking down historical files, which some states archive inconsistently or in different formats, can be a separate hunt entirely.
And across all of this, there were 31 different answers to the question, “How do you organize voter registration data?”
California reports each county twice — one row for raw counts, one for percentages:

Connecticut reports by town and county, which meant aggregating municipalities up to the county level before I could compare its data to any other state.

To pull this together consistently and get comparable data, I wrote a series of small computer programs, or "scripts," one for each state, to collect the data and parse it into a common format.
Straightforward! Until you realize that "Republican" isn't always reported as "Republican."
Across the 30 states plus DC, Republican party affiliation is reported as REP, Rep, REPUBLICAN, Republican, Republicans, and a handful of other variations. Same on the Democratic side. Every inconsistency is a decision: are these the same thing? To us, obviously. But the computer needs that specific instruction.

All the ways the two major parties were represented in the data.
And not every party name was as easy to sort as REP vs. Republican. In some states, 'Independent' is just another word for unaffiliated. In others, it's an actual minor party with its own ballot line. (More on that in a moment.)
Judgment calls
Once I had the data in a common format, I still had to make decisions about how to use it. Not every question had an obvious right answer.
How far back should I look?
I wanted to show change over time, which meant picking a starting point. Presidential election years felt like natural bookmarks, and a full decade felt long enough to show real, meaningful shifts rather than just noise.
That pointed pretty clearly to 2016.
I also wanted to avoid using 2020 as a baseline. Registration patterns during a pandemic election year are unusual enough that starting there could distort the picture.
Most states had November 2016 data publicly available. A few didn't go back quite that far — Idaho and Rhode Island go back to 2018. Kentucky technically had 2016 data, but it was from February rather than after the election; that felt different enough that I used its 2017 numbers instead.
For any state without data going back to 2016, I used the most distant pre-2020 data available.
(If you're more interested in recent shifts, the charts in the main piece let you zoom in — they show movement year by year, so you're not locked into the decade-long view.)
What about states without county-level data?
Three states — Utah, New Hampshire, and Alaska — had data going back far enough, but only at the state level. More granular data exists for recent years, but mixing county- and state-level data in the same state would make historical comparisons unreliable. I used state-level totals only for these three, so they show up in some parts of the analysis but not in the county-level maps and charts.
Twenty-seven states and DC publicly share county-level party affiliation data
Data availability for 2016–2026
Who counts as "unaffiliated"?
This is where it gets a little complicated.
In some states, "Independent" is essentially synonymous with unaffiliated — it just means the voter didn't pick a party. In others, the Independent Party is a recognized minor party with its own candidates and ballot line.
Making that distinction consistently across 31 different datasets felt like a losing battle, so I grouped all minor party registrations and unaffiliated voters together into a single category, which you'll see labeled as "Other / Unaffiliated." It's worth noting that our broader party affiliation tracker handles this differently, keeping minor party and unaffiliated voters separate where possible. Neither approach is wrong — they're just answering slightly different questions.
Active vs. inactive voters
Some states also distinguish between active and inactive voters; someone who hasn't responded to address confirmation notices and may have moved or become otherwise ineligible would be considered inactive. For those states, I used active voter data only, using the approach USAFacts has taken in previous reporting.
What comes next?
All the scripts, judgment calls, and data wrangling was in service of one thing: turning scattered data into something that helps us understand what's happening, not just in one state, but in many. We’ve built two articles from this data, one on the most up-to-date state-level numbers, and the other a retrospective on how county-level affiliation has shifted over the past decade. As we continue gathering the latest data, we'll keep asking questions and sharing what we find.
