What percentage of students in are proficient in math?

Refreshed intermittently
About 43% of 4th graders and 32% of 8th graders in New Hampshire were considered proficient in math in 2024, according to the National Assessment of Educational Progress (NAEP). The NAEP, also known as the Nation's Report Card, assesses 4th and 8th graders' progress in reading and math approximately every two years. Students in public, private, and charter schools are included in NAEP testing.

43%

of New Hampshire 4th graders were proficient in math in 2024

32%

of New Hampshire 8th graders were proficient in math in 2024
The NAEP uses a scale of 0-500 points to group 4th and 8th grade students into three achievement levels (basic, proficient, or advanced). "Proficient" is the benchmark used to describe students who demonstrate competency with challenging subject matter. However, NAEP proficiency is not the same as being on "grade level," which is often assessed by other state and district tests. More information on NAEP skill expectations at each grade level is available here.
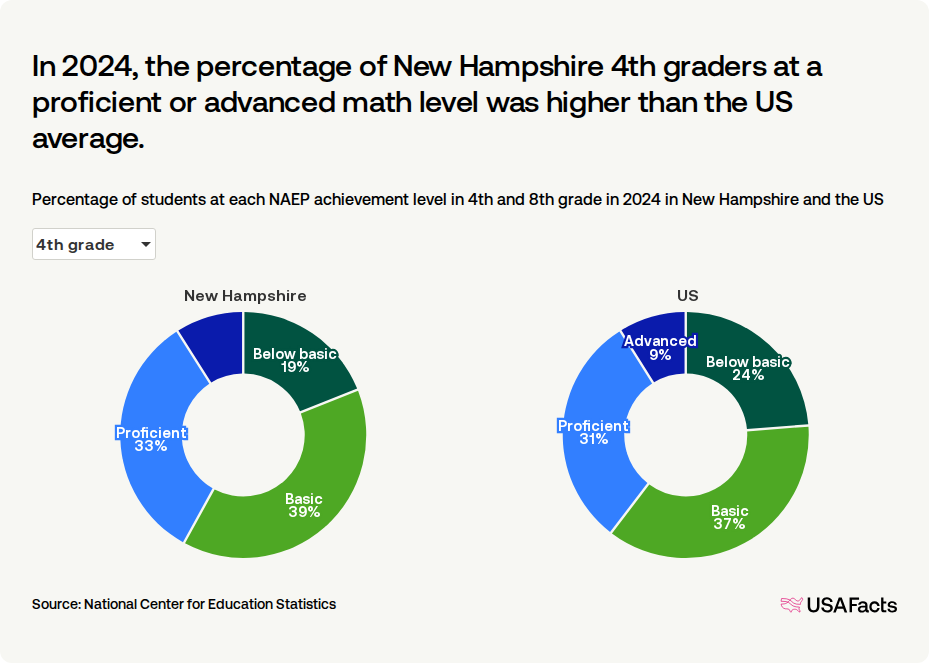
In 2024, 9% of 4th graders in New Hampshire were advanced in math and 33% were proficient, which means that about 4 out of 7 (57%) scored at basic or below. Sixty-eight percent of 8th graders scored at basic or below.

New Hampshire 4th graders in 2024 were higher than the US average in math proficiency. 8th grade proficiency was also higher than the US.

In 2024, the percentage of New Hampshire 4th graders at a proficient or advanced math level was higher than the US average.

Percentage of students at each NAEP achievement level in 4th and 8th grade in 2024 in New Hampshire and the US
How has math proficiency changed over time?

From this point onward, “proficiency” includes students who were at or above proficient in math (proficient and advanced students).
Among 4th graders, math proficiency was higher in New Hampshire than the US in every test year since 2003. Among 8th graders, math proficiency in New Hampshire was higher than the US in 10 test years (2003, 2005, 2007, 2009, 2011, 2013, 2015, 2017, 2019, and 2024). In all other test years since 2003, there was not a significant difference between New Hampshire and the US.

New Hampshire 4th graders had higher math proficiency than the US in every test year

Percentage of 4th and 8th graders who were proficient in math in New Hampshire and the US, 1992–2024

Math proficiency has also varied over time for students of varying demographics. This is often referred to as the achievement gap.

Get weekly insights

Subscribe for data-driven insights. No spin, just the facts.

Among 4th graders in 2024, Asian/Pacific Islander students had the highest rate of math proficiency.

In 8th grade, Asian/Pacific Islander students also have had the highest rate of math proficiency of all groups since 2009.

The math proficiency rate for Asian/Pacific Islander students in 4th grade is 2.5 times higher than the group with the lowest (Hispanic students) in 2024.

Percentage of 4th and 8th graders who were proficient in math in New Hampshire, by race/ethnicity, 1992–2024

Does math proficiency differ by gender?

In 2024, male students had higher math proficiency than female students in 4th grade (47% and 38%, respectively). The same was true for 8th graders.

How do New Hampshire students compare to other states in math proficiency?

New Hampshire had the 11th highest 4th grade math proficiency rate in the US in 2024, in between Ohio and South Dakota. This is 8 percentage points lower than Massachusetts, the state with the highest proficiency (51%). For 8th graders, New Hampshire was 12th highest in math proficiency.

New Hampshire is 11th highest in 4th grade math proficiency and 12th highest in 8th grade

Percentage of 4th and 8th graders in each state who were proficient in math in 2024

Keep exploring

Methodology

USAFacts standardizes data, in areas such as time and demographics, to make it easier to understand and compare.

Page sources

USAFacts endeavors to share the most up-to-date information available. We sourced the data on this page directly from government agencies; however, the intervals at which agencies publish updated data vary.