What percentage of students in District of Columbia Public Schools are proficient in math?
Refreshed intermittently
About 38% of 4th graders and 22% of 8th graders were considered proficient in math in 2024, according to the National Assessment of Educational Progress (NAEP). The NAEP, also known as the Nation’s Report Card, assesses 4th and 8th graders’ progress in reading and math approximately every two years.
38%
of District of Columbia Public Schools 4th graders were proficient in math in 2024
22%
of District of Columbia Public Schools 8th graders were proficient in math in 2024
The NAEP uses a scale of 0-500 points to group 4th and 8th grade students into three achievement levels (basic, proficient, or advanced). "Proficient" is the benchmark used to describe students who demonstrate competency with challenging subject matter. However, NAEP proficiency is not the same as being on "grade level," which is often assessed by other state and district tests. More information on NAEP skill expectations at each grade level is available here.
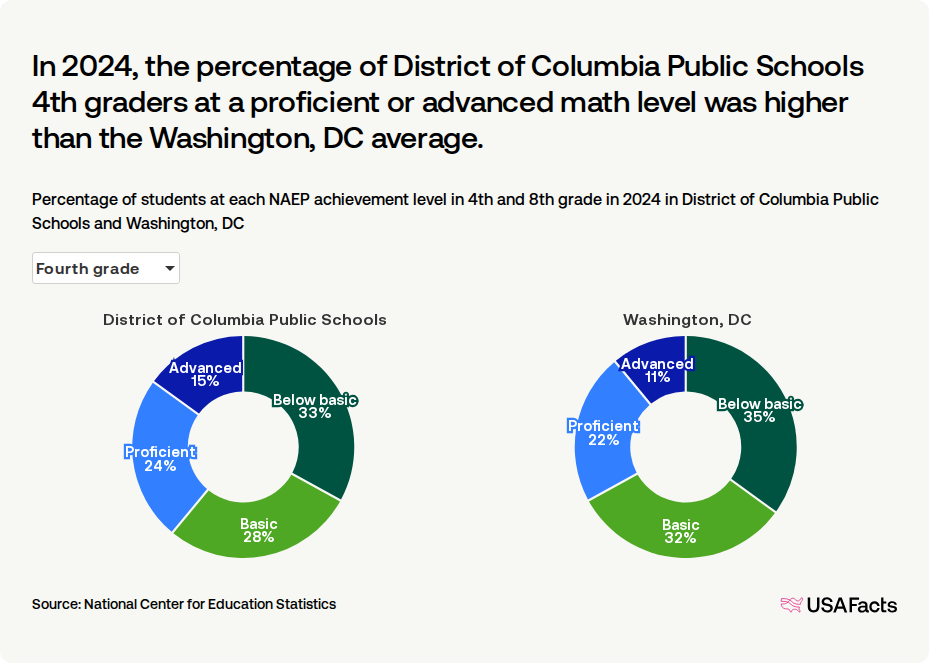
In 2024, 15% of 4th graders in District of Columbia Public Schools were advanced in math and 24% were proficient, which means that about 5 out of 8 (62%) scored at basic or below. In 8th grade, 78% scored at basic or below.
In District of Columbia Public Schools, 4th grade math proficiency scores in 2024 were higher than Washington, DC overall. 8th grade proficiency was not significantly different from the Washington, DC average.
In 2024, the percentage of District of Columbia Public Schools 4th graders at a proficient or advanced math level was higher than the Washington, DC average.
Percentage of students at each NAEP achievement level in 4th and 8th grade in 2024 in District of Columbia Public Schools and Washington, DC
How has math proficiency changed over time?
From this point onward, “proficiency” includes students who were at or above proficient in math (proficient and advanced students).
Among 4th graders, math proficiency in District of Columbia Public Schools was higher than Washington, DC as a whole in 6 test years (2009, 2011, 2013, 2015, 2022, and 2024). In all other test years, there was not a significant difference between District of Columbia Public Schools and Washington, DC as a whole. Among 8th graders, math proficiency in District of Columbia Public Schools was lower than Washington, DC as a whole in 3 test years (2011, 2013, and 2015). In all other test years, there was not a significant difference between District of Columbia Public Schools and Washington, DC as a whole.
Data are available in District of Columbia Public Schools beginning in 2003.
District of Columbia Public Schools 4th graders had higher math proficiency than Washington, DC as a whole in 6 out of 11 test years
Percentage of 4th and 8th graders proficient in math in District of Columbia Public Schools, Washington, DC, and the US, 2003–2024

Get weekly insights
Subscribe for data-driven insights. No spin, just the facts.
How do District of Columbia Public Schools students compare to other districts in math proficiency?
The NAEP collected data in 25 other large urban school districts in 2024. District of Columbia Public Schools had 51,294 students enrolled as of the 2023-24 school year, making it the fifth-smallest district in this sample.
Among 4th grade students, District of Columbia Public Schools had the eighth-highest math proficiency rate compared to other districts. It was 11 percentage points lower in proficiency than Miami-Dade County Public Schools, the district with the highest rate (49%).
Among 8th grade students, District of Columbia Public Schools had the ninth-highest math proficiency rate compared to other districts. It was 10 percentage points lower in proficiency than Charlotte-Mecklenburg Schools, the district with the highest rate (32%).
District of Columbia Public Schools is eighth-highest in 4th grade math proficiency and ninth-highest in 8th grade among the 26 districts tested
Percentage of 4th and 8th graders in each district who were proficient in math in 2024

Why is there data for District of Columbia Public Schools but not all districts?
The NAEP randomly chooses public, private, and charter schools from across the country and in each state and Washington, DC to participate in testing. This random process ensures that the test scores from students in these schools represent how the US and each state are performing as a whole. In addition to national- and state-level reporting, for several years the NAEP has also administered the test to a random sample of schools within 26 of the nation's largest school districts in 2024, of which District of Columbia Public Schools was one.
Keep exploring

Methodology
USAFacts standardizes data, in areas such as time and demographics, to make it easier to understand and compare.
Page sources
USAFacts endeavors to share the most up-to-date information available. We sourced the data on this page directly from government agencies; however, the intervals at which agencies publish updated data vary.
