The US imported $331.8 billion in goods and services from China and exported $164.2 billion to China in 2025. That means that the US imported $167.6 billion more from China than we exported to it. Benefits of trade can include higher wages and job growth, a wider variety of products available at lower prices, increased productivity, and more efficient resource allocation.
$332B
Value of imports from China to the US (2025)
$164B
Value of exports from the US to China (2025)
Exports are goods and services the US sells to other countries. Imports are goods and services the US buys from other countries. Combining the value of imports and exports shows us how much trade happens between the US and other countries.
Get weekly insights
Subscribe for data-driven insights. No spin, just the facts.
The Bureau of Economic Analysis (BEA) provides data for 71 of the US' trading partners (though not necessarily the top 71 trading partners). The partners they track accounted for 94% of total trade with the US in 2025.
How high is China ranked as a US trade partner?
BEA data ranks China as the US’ 3rd top trading partner: In 2025, the US traded $496 billion in goods and services with China. Countries with similar trade values include Canada ($879.9B) and United Kingdom ($371.6B).
In 2025, the US traded $496 billion in goods and services with China.
Total trade value (imports + exports) with the US (2025), by select countries
Another way to look at international trade is through trade balance. A nation that imports more than it exports, has a trade deficit. One that exports more than it imports has a trade surplus. Neither is inherently good or bad; trade balance is just a metric that shows the relationship between imports and exports.
What is the trade balance with China?
The US has had a trade deficit with China every year from 1999 through 2025. The 2025 deficit was $167.6 billion, a decrease from 2024's deficit of $264.7 billion.
The trade deficit with China decreased to $167.6B in 2025.
Annual trade balance with China, not adjusted for inflation
What does the US import from China?
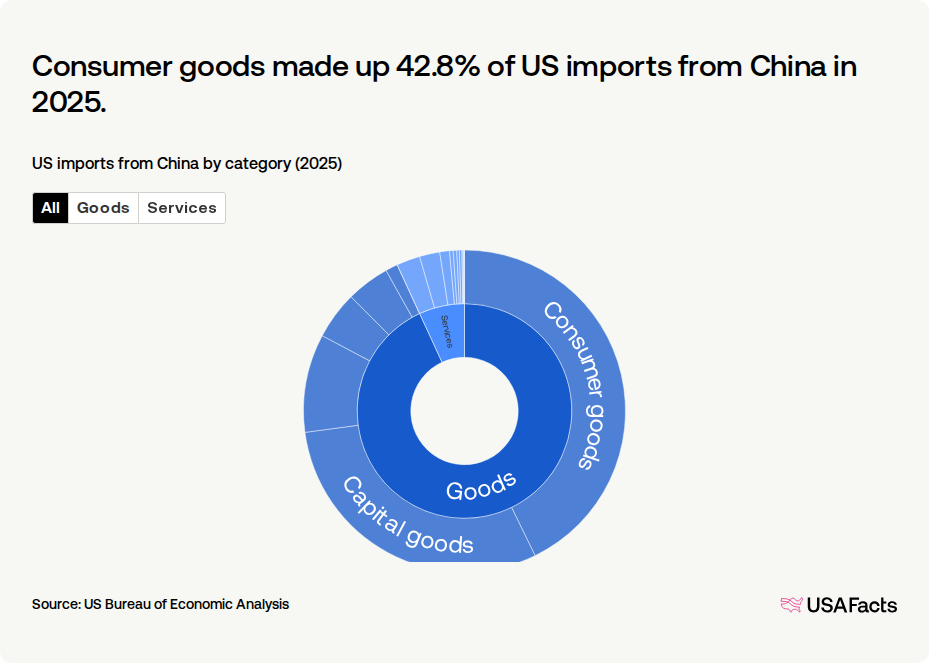
In 2025, 93.1% of imports from China to the US were goods. The largest category was consumer goods (goods and services purchased by individuals for personal use, like clothing and cellphones), accounting for $141.9 billion. The top three imports were consumer goods, capital goods, and industrial supplies and materials. These categories accounted for $274.6 billion of total imports.
The other 6.9% were services, with business services being the largest service category. Business services (like R&D, consulting, and tech services) accounted for $7.84 billion.
Consumer goods made up 42.8% of US imports from China in 2025.
US imports from China by category (2025)
What does the US export to China?
In 2025, more US exports to China were goods — 65.2%. The largest export was capital goods, which accounted for a value of $50.7 billion. The top three exports were capital goods, industrial supplies and materials, and consumer goods. These categories accounted for $93.3 billion of exports to China.
The other 34.8% were services, with travel being the largest service category. Travel (money entering the US from foreign visitors on expenses like lodging, meals, transportation, and entertainment) accounted for $24 billion.
Capital goods made up 30.9% of US exports to China in 2025.
US exports to China by category (2025)
Value of imports and exports, by category (2025)
Value of imports and exports, by category (2025)
1.
Consumer goods
$141.9 billion
2.
Capital goods
$99.9 billion
3.
Industrial supplies and materials
$32.7 billion
4.
Automotive vehicles and parts
$15.9 billion
5.
Other merchandise
$14.4 billion
6.
Business services
$7.84 billion
7.
Transport
$6.75 billion
8.
Food, feeds, and beverages
$4.11 billion
9.
Travel
$3.23 billion
10.
Use of intellectual property
$1.21 billion
Steve Ballmer talks about trade and tariffs in under 20 minutes
Keep exploring
Methodology
USAFacts standardizes data, in areas such as time and demographics, to make it easier to understand and compare.
Page sources
USAFacts endeavors to share the most up-to-date information available. We sourced the data on this page directly from government agencies; however, the intervals at which agencies publish updated data vary.