What is the poverty rate in Baltimore County, MD?
Refreshed monthly
In 2020–2024, about 9.8% of the population lived under the poverty line. The poverty rate is the percentage of people in a population whose household income falls below the poverty threshold set by the government. It measures the share of individuals or families who do not earn enough to meet basic needs such as food, housing, and healthcare. On average, 81,300 people were considered in poverty.
9.8%
of the population (2020–2024)
81.3K
people living under the poverty line (2020–2024)
Based on data from the American Community Survey, Baltimore County's poverty rate during 2020–2024 was higher than the 9% poverty rate during the previous five years (2015–2019).
In 2024, 9.8% of the population in Baltimore County, MD were living under the poverty line.
Poverty rate

In 2020–2024, 81,300 residents of Baltimore County were living under the poverty line, up 11.3% from 73,100 during the previous five years (2015–2019).
Get weekly insights
Subscribe for data-driven insights. No spin, just the facts.
In 2020–2024, about 81,300 people in Baltimore County, MD were living under the poverty line.
People living under poverty line

Poverty doesn’t affect all groups equally. Rates vary widely by demographic group, family type and location.
From 2015–2019 to 2020–2024, the poverty rate for children under 18 in Baltimore County increased from 11.4% to 12.2%. During the same period, the poverty rate for adults under 65 years increased from 8.6% to 8.8%. For those older than 65, the poverty rate increased from 7.6% to 10.2%.
In Baltimore County, MD, the poverty rate for children increased from 11.4% in 2015–2019 to 12.2% in 2020–2024.
Poverty rate

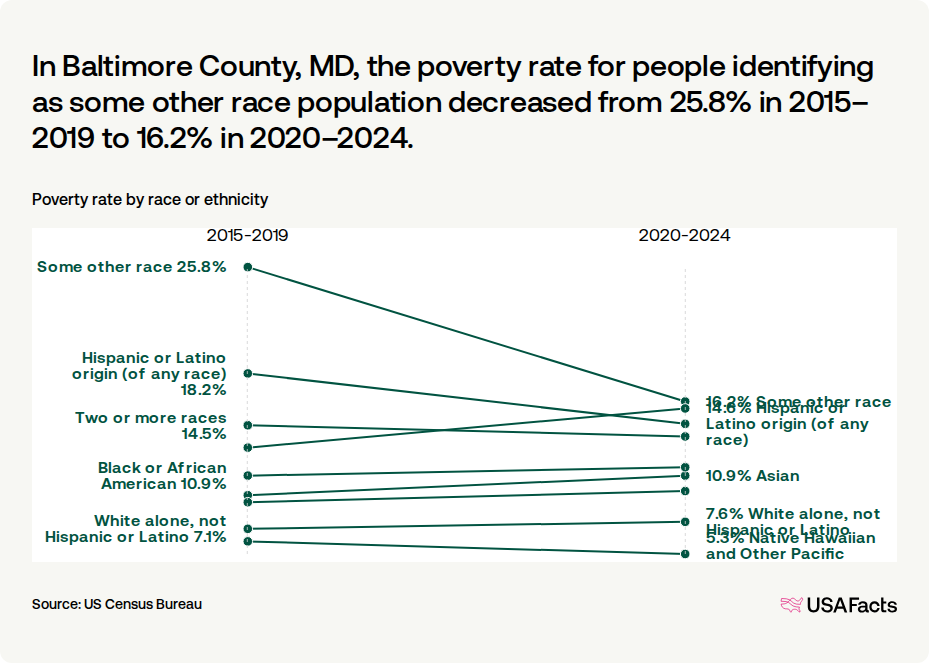
Among racial or ethnic groups in Baltimore County during 2020–2024, six had a higher poverty rate than the county’s overall rate: American Indian and Alaska Native, Asian, Black or African American, Hispanic or Latino origin (of any race), Some other race, and Two or more races.
Two groups had a lower than average poverty rate: Native Hawaiian and Other Pacific Islander and White alone, not Hispanic or Latino.
The poverty rate for the Some other race population shifted the most, decreasing from 25.8% in 2015–2019 to 16.2% in 2020–2024.
In Baltimore County, MD, the poverty rate for people identifying as some other race population decreased from 25.8% in 2015–2019 to 16.2% in 2020–2024.
Poverty rate by race or ethnicity
Keep exploring

Methodology
USAFacts standardizes data, in areas such as time and demographics, to make it easier to understand and compare.
Page sources
USAFacts endeavors to share the most up-to-date information available. We sourced the data on this page directly from government agencies; however, the intervals at which agencies publish updated data vary.
