What is the student-teacher ratio of public schools in the ?

Refreshed annually
About 15.1 students for every teacher during the 2024–25 school year. The ratio measures the number of students against the number of full-time teachers employed at a school or district. This figure excludes Tennessee, as this state was missing data on the number of teachers in the 2024–25 school year. The student-teacher ratio is not the same as class size, which describes the number of students in a given classroom. Student-teacher ratios are nearly always lower than average class sizes for the same school or district, as the ratio often includes teachers who may not manage their own classroom but assist in instruction (such as a teacher's aide).
During the 2024-25 school year, there were

15.1

public school students for every teacher
During the 1955-56 school year, there were

26.9

public school students for every teacher
Teachers include those who are considered pre-kindergarten, kindergarten, primary, secondary or ungraded teachers by the National Center for Education Statistics. Special education teachers are also included in the student-teacher ratio. Ratios don’t include administrators, counselors, library staff or other school professionals.
Public school student-teacher ratios dropped from the 1950s to the early 2000s as the number of teachers hired outpaced student enrollment. The ratio decreased by 43% from the 1955–56 school year to the 2009–10 school year, reaching 15.4 students per teacher. The ratio then rose in 2010–11 to 16 students per teacher and remained stable for about a decade. The student-teacher ratio dropped again to 15.4 at the 2020–21 school year, an effect of the COVID-19 pandemic. It has decreased by 0.3 students since then.

Between the 2000-01 and 2024-25 school years, the student-teacher ratio has been between 15.1 to 16.1

Student-teacher ratio in public schools, school years 1955-56 to 2024-25

A decreasing student–teacher ratio has generally meant that the number of teachers in the workforce has grown faster than the number of enrolled students. However, this trend reversed between the 2009–10 and 2010–11 school years, when there was a 3.4% decrease in teachers and the student population grew slightly. The opposite happened between 2019–20 to 2020–21: student enrollment decreased by 2.8% while teacher employment stayed about the same. In 2023-24, there was an increase in teachers of 0.9% and a decrease in students of 0.2% from the previous year. This caused the student-teacher ratio to drop from 15.4 to 15.2.

Between school years 2022–23 and 2023–24, the number of teachers grew faster than the number of students, leading to a decline in the student-teacher ratio.

Annual percent change in the number of public-school teachers and students, 1976 to 2023

Get weekly insights

Subscribe for data-driven insights. No spin, just the facts.

What are the student-teacher ratios by state?

The student-teacher ratio varies by districts and across states because of demographics, finances, state education policy, and other factors. Many state laws specify minimum ratios that districts must reflect in their hiring policies.  Vermont had the lowest student-teacher ratio during the 2024-25 school year at 10.3. California had the highest at 21.7.

In SY 2024–25, student-teacher ratios were lowest in Vermont and highest in California.

Student-teacher ratio in public schools, school year 2024-25

What are the student-teacher ratios in the US’s largest school districts?

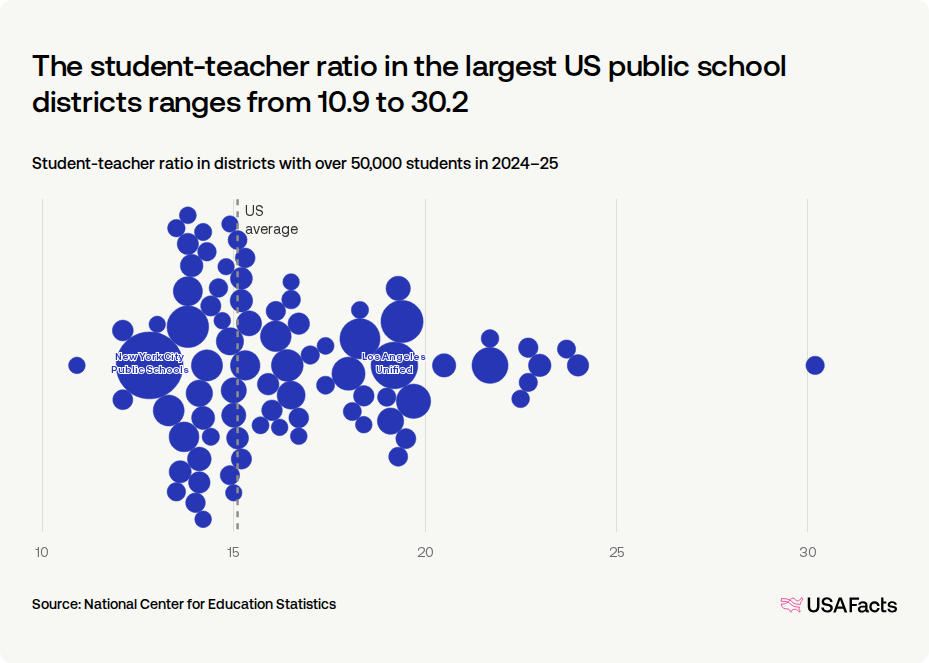
The student-teacher ratio also varies within the nation's largest school districts. New York City Public Schools, which serves more students than any other nationwide, had a student-teacher ratio below the US average at 12.8 students per teacher in SY 2024-25. The next largest district, Los Angeles Unified School District, had a ratio above the US average, at 19.2.

The student-teacher ratio in the largest US public school districts ranges from 10.9 to 30.2

Student-teacher ratio in districts with over 50,000 students in 2024–25
Student-teacher ratio in public schools, by state and Washington, DC in 2024-25

Student-teacher ratio in public schools, by state and Washington, DC in 2024-25
StateStudent-teacher ratio

Vermont 

10.3

District of Columbia

10.9

Maine 

11.0

New Hampshire

11.3

North Dakota

11.5

New York

11.6

Connecticut 

11.8

New Jersey

11.8

Massachusetts 

11.9

Wyoming 

12.1

Keep exploring

Methodology

USAFacts standardizes data, in areas such as time and demographics, to make it easier to understand and compare.

Page sources

USAFacts endeavors to share the most up-to-date information available. We sourced the data on this page directly from government agencies; however, the intervals at which agencies publish updated data vary.