What is the income of a household in St. Louis city, MO?
About $55,300 in median income in 2019–2023. Household income is the total money received in a year — wages, pensions, investments, public assistance, and more — by everyone in a household over 15.
Data updated February 19, 2025
$55.3K
Median household income (2019–2023)
19.8%
lower than Missouri (2019–2023)
Median incomes vary by geography due to a range of factors: differences in cost of living, local job markets, and economic opportunities, such as the presence of high-paying industries or declining sectors. Regional policies, access to education, and variations in economic development can also play a role in shaping incomes across locations.
Median household income in St. Louis city, MO was $55,300 from 2019–2023. This was 19.8% lower than in the state of Missouri, and 29.6% lower than in the US.
From 2019–2023, median household income in St. Louis city, MO was 19.8% lower than in Missouri as a whole, at $55.3K.
Median household income by geographic area in 2019–2023, adjusted for inflation (2023 dollars)

The median household income is a useful summary, but it doesn’t fully capture the income landscape. Examining the income distribution provides insight into economic diversity and reveals patterns in income concentrations across different brackets. This perspective helps to better understand the range of and disparities in household earnings.
From 2019–2023, half of households in St. Louis city, MO made more than $55,300 and the other half made less. Compared to Missouri as a whole, St. Louis city had more households in the less than $50,000 income range and fewer in the $100,000 to $149,999 range.
From 2019–2023, half of households in St. Louis city, MO made over $55.3K and the other half made less.
Share of households in each income group in St. Louis city, MO (2019–2023)

Household income can differ depending on the makeup of the household.
Married couple households (with and without kids) had a higher median income than other types of familial households in 2019-2023. Among nonfamily households, males not living alone had a higher median income than females not living alone.
From 2019–2023, married-couple households had the highest median income.
Median income by household type in St. Louis city, MO in 2019–2023, adjusted for inflation (2023 dollars)

Lastly, household income also varies by geography due to differences in cost of living, local job markets, and economic opportunities (e.g. the presence of high-paying industries or declining sectors). Regional policies (like minimum wage), access to education, and other economic factors can also play a role in shaping local income levels.
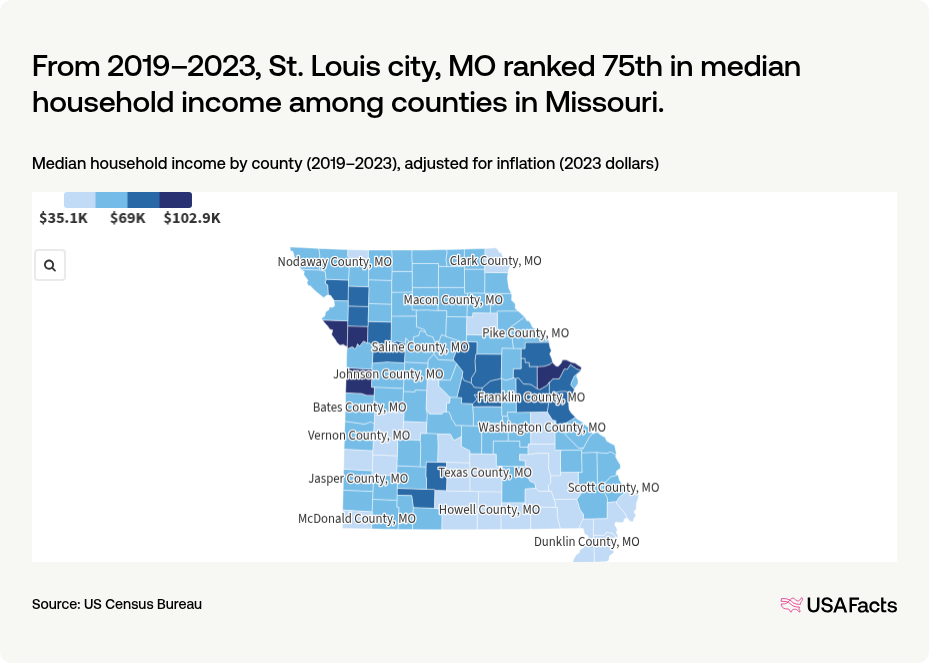
When ranked highest to lowest, St. Louis city was ranked 75th in median household income among counties in Missouri from 2019–2023. Counties with a similar median income include Randolph County (74th) and Miller County (76th).
From 2019–2023, St. Louis city, MO ranked 75th in median household income among counties in Missouri.
Median household income by county (2019–2023), adjusted for inflation (2023 dollars)
Change location to see this data for another state or county.
Keep exploring
- Semiquincentennial snapshot: the US at 250 years - Insights about the nation's population, households, education, employment, and income.
- US obesity rates have tripled over the last 60 years - Nationwide surveys show that 40% of Americans are obese, while 10% are severely obese.
- How many people live in subsidized housing in St. Louis city, MO?
- How do American households save for retirement? - Self-employed households have less money in retirement accounts but more in checking, savings, and financial assets than families with heads of households working for employers.
Methodology
USAFacts standardizes data, in areas such as time and demographics, to make it easier to understand and compare.
Page sources
USAFacts endeavors to share the most up-to-date information available. We sourced the data on this page directly from government agencies; however, the intervals at which agencies publish updated data vary.
