What is the average US tariff rate overall?
6.5%
7.6%
What is an effective tariff rate?
What is an effective tariff rate?
The “effective tariff rate” is based on estimated customs duties: tariffs and other import-related fees that the US collects on goods brought into the country. These estimates don’t always match the exact amount importers paid. Why?
- Some goods qualify for partial or full duty-free treatment (like some goods made by a trading partner with a free trade agreement). That can make duties look higher than what was actually paid.
- For goods with special or variable rates, customs may report a dutiable value but not calculate the duty. That makes the estimate lower than the true amount.
Because of these adjustments, the figures are best understood as approximations of the effective tariff rate, not precise dollar-for-dollar payments.
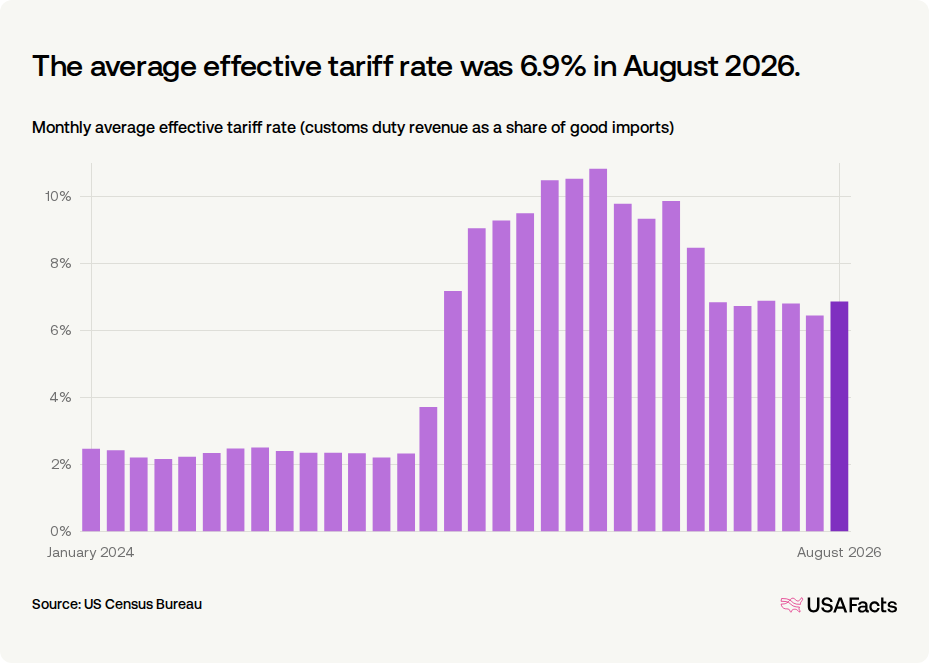
The average effective tariff rate was 6.5% in July 2026.
Monthly average effective tariff rate (customs duty revenue as a share of good imports)
How have tariff rates varied over time?
Get weekly insights
Subscribe for data-driven insights. No spin, just the facts.
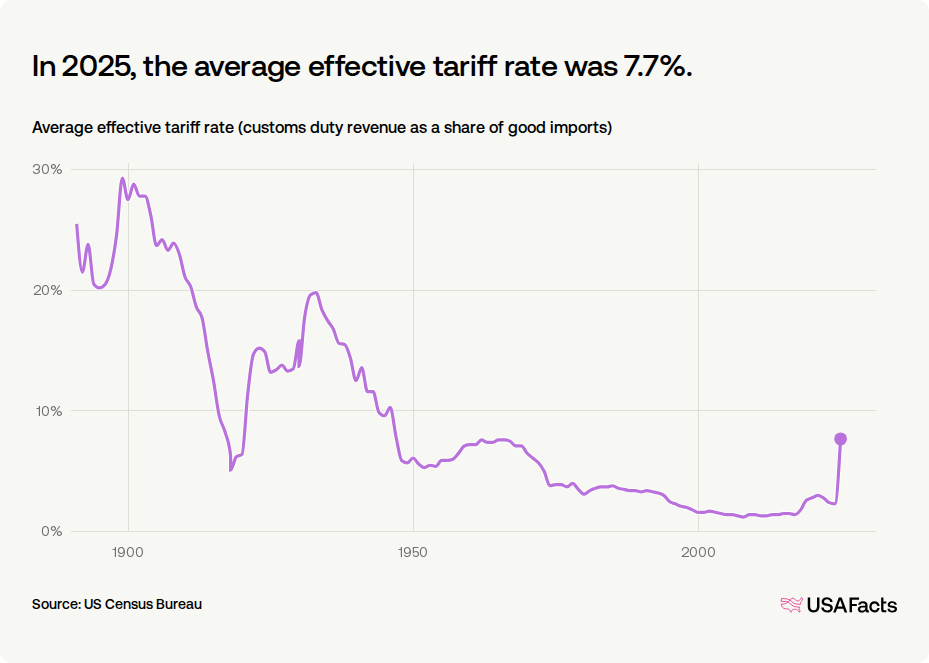
In 2025, the average effective tariff rate was 7.6%.
Average effective tariff rate (customs duty revenue as a share of good imports)
How are tariff rates determined?
- Trade agreements: Free trade agreements, like the United States–Mexico–Canada Agreement (USMCA), set many tariffs at zero between partners. The US has free trade agreements with 20 countries.
- Normal trade relations: Most countries trade with the US under “normal trade relations” status, which provides standard tariff rates.
- Special cases: Some nations, including Cuba, Russia, Belarus, and North Korea, do not have “normal trade relations” status. Imports from these countries face higher rates set by law.
- Preference programs: Some developing countries qualify for reduced rates under special programs. For example, the African Growth and Opportunity Act (AGOA) lets many sub-Saharan African nations export textiles and other goods duty-free.
- Product mix: The types of goods imported from a country also matter. For example, agricultural products or textiles may carry higher rates than raw materials like metals or oil.
What countries have the highest tariffs?
In July 2026, Bahrain had the highest tariff rate at 43.1%.
Average effective tariff rate, by country or geographic area (July 2026 and 2025)

Average effective tariff rates, by goods imports categories
| 1. | Articles of iron and steel | 42.1% |
| 2. | Aluminum and articles thereof | 39.1% |
| 3. | Iron and steel | 27.1% |
| 4. | Articles of leather, saddles, travel goods, handbags, & animal gut articles | 22% |
| 5. | Apparel and clothing accessories, knitted or crocheted | 21.8% |
| 6. | Railway or tramway locomotives, track fixtures, mechanical traffic signalling equipment, etc. | 21% |
| 7. | Apparel and clothing accessories, not knitted or crocheted | 21% |
| 8. | Footwear, gaiter, & parts of such articles | 20.1% |
| 9. | Knitted or crocheted fabrics | 18.2% |
| 10. | Special woven fabrics, textile fabrics, lace, tapestries, etc. | 16.9% |
Keep exploring

Methodology
USAFacts standardizes data, in areas such as time and demographics, to make it easier to understand and compare.
Page sources
USAFacts endeavors to share the most up-to-date information available. We sourced the data on this page directly from government agencies; however, the intervals at which agencies publish updated data vary.

