How much debt does the US have?
Refreshed monthly
The US has $39.2 trillion in debt as of May 2026. The federal government borrows money when its spending and investments cannot be funded by federal revenue alone; this debt enables the government to pay for programs and services when funds aren’t immediately available.
In May 2026
$39.2T
was the total national debt.
In 2025
$113K
in debt was held by the US government per person.
When the federal government spends more money than it brings in through taxes and other revenue sources, a budget deficit occurs. To cover the deficit, it borrows money by selling bonds and other securities. Generally, the federal debt is an accumulation of budget deficits over time.
How has national debt changed over time?
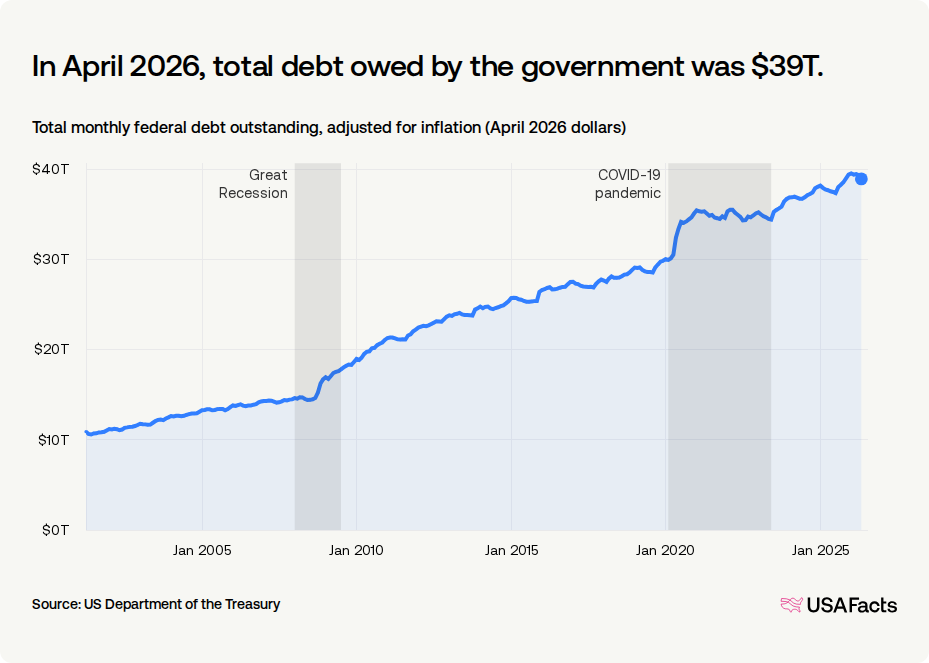
The federal debt in the most recent month of data, May 2026, was $39.2 trillion. This is 4% higher than in May 2025 and up 36% from 2019, before the COVID-19 pandemic.
In May 2026, total debt owed by the government was $39.2T.
Total monthly federal debt outstanding, adjusted for inflation (May 2026 dollars)
What is the national debt per person?
Dividing the total debt by the population of the US reveals the per-person debt, or the average amount of debt for each person. This makes it easier to compare debt levels between different countries or time periods, since it accounts for changes in population size.
Get weekly insights
Subscribe for data-driven insights. No spin, just the facts.
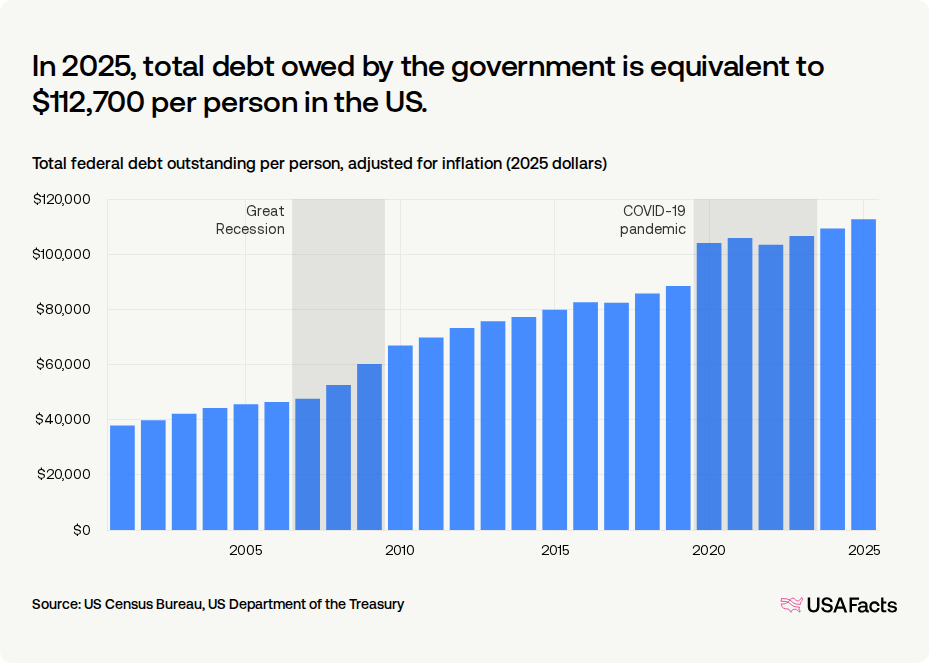
Per-person debt has increased at an average rate of 5% per year since 2001. As of 2025 — the last year for which there is population data — the federal debt was equivalent to $112,700 per-person, for a total of $38.5 trillion.
In 2025, total debt owed by the government is equivalent to $112,700 per person in the US.
Total federal debt outstanding per person, adjusted for inflation (2025 dollars)
What is debt as a percentage of GDP? Why does it matter?
Another way to understand a country's debt is to compare it with its gross domestic product (GDP). GDP, broadly speaking, is a measure of the value of an economy. Analyzing the debt in context of GDP makes it easier to track the debt alongside changes in economy and inflation, allowing for comparisons of the debt over time; it can also indicate a country's ability to repay its debt. When debt reaches 100% of a nation's GDP, it indicates that the country owes about as much as its economy generates annually.
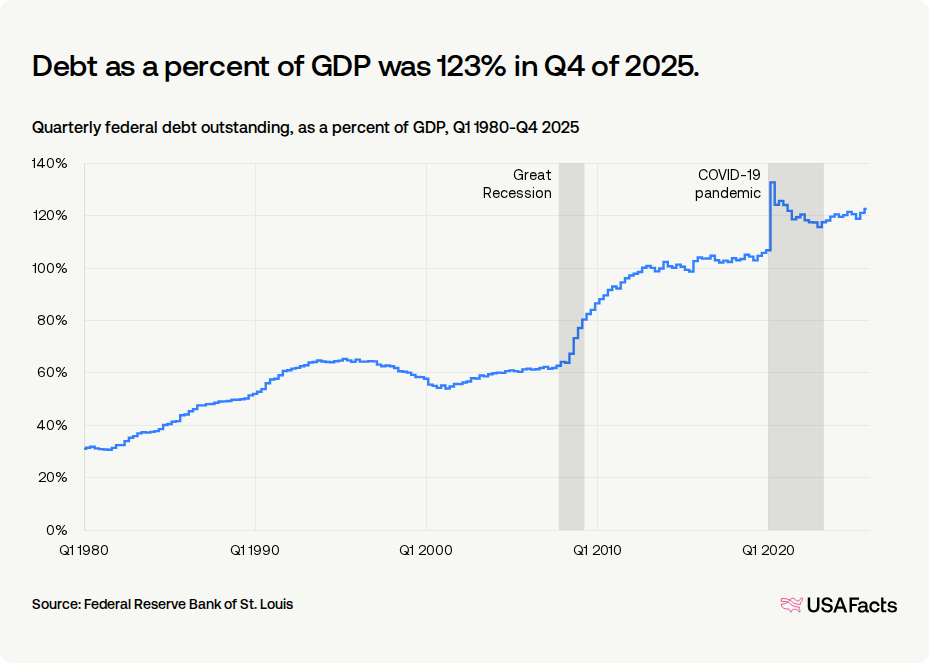
The nation's debt as a percentage of GDP first surpassed 100% in Q4 of 2012. It remained relatively stable until Q1 of 2020, when GDP decreased as government spending increased. It reached a peak of 133% in Q2 of 2020. As of Q4 2025, the debt as a percentage of GDP was 123%.
Debt as a percent of GDP was 123% in Q4 of 2025.
Quarterly federal debt outstanding, as a percent of GDP, Q1 1980-Q4 2025
What does the US pay in interest on the debt?
The government has to pay interest on its debts, the same way individuals pay interest on credit card bills, mortgages, and car payments. Interest payments aren’t fixed, and change based on the size of the debt and current interest rates.
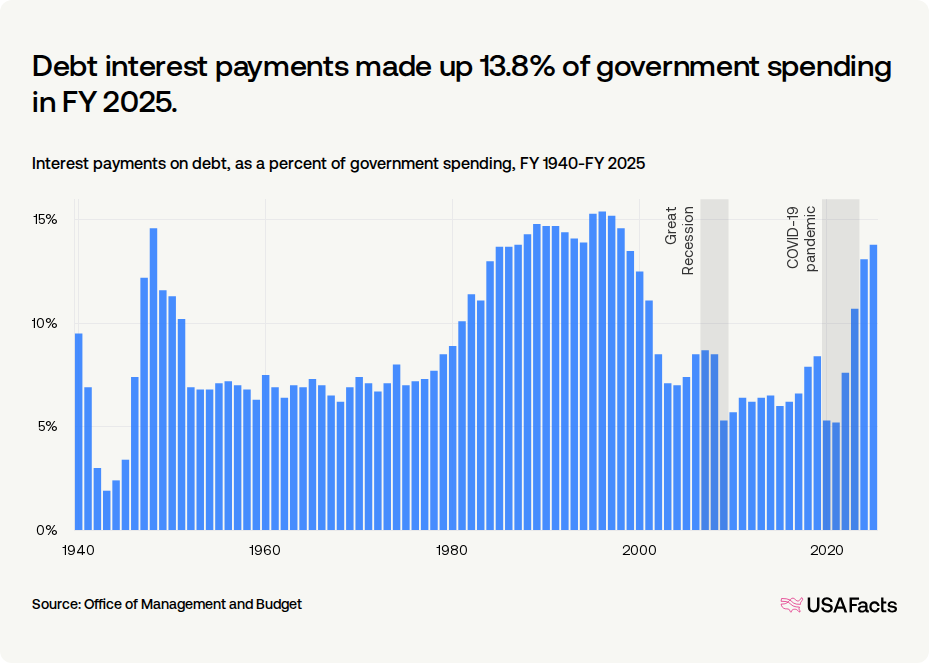
Interest payments as a share of government spending spiked towards the end of the COVID-19 pandemic as spending slowed and interest rates increased.
As of FY 2025, the share is 13.8%.
Debt interest payments made up 13.8% of government spending in FY 2025.
Interest payments on debt, as a percent of government spending, FY 1940-FY 2025
Steve Ballmer explains the national debt in under 13 minutes
Keep exploring
Methodology
USAFacts standardizes data, in areas such as time and demographics, to make it easier to understand and compare.
Page sources
USAFacts endeavors to share the most up-to-date information available. We sourced the data on this page directly from government agencies; however, the intervals at which agencies publish updated data vary.

