How much debt does the average person in owe?

Refreshed annually
People in Oklahoma owed $43,200 in debt on average in 2025. Compared to the previous year, the average adult owed $188 more debt after adjusting for inflation, reflecting slight shifts in household borrowing patterns. This debt, often referred to as “household debt,” represents the total amount owed by individuals for obligations such as mortgages, student loans, credit cards, and auto loans.
These figures represent the average debt owed by Oklahoma residents with a credit score. (Nationally, roughly 80% of adults have a credit score.) While this gives a general sense of the debt burden for Oklahoma residents, remember that actual individual debt varies — some may carry much more or less debt than this average. Debt levels also fluctuate over time, especially during times of economic instability.

$43.2K

in debt owed by the average person with a credit score (2025)

$188

more debt owed by residents with a credit score (2025 vs 2024, adjusted for inflation)
Debt levels also fluctuate over time, especially during times of economic instability. According to the Federal Reserve Bank of New York, household debt increased in the early 2000s, largely driven by housing debts like mortgages. Following the downturn in home prices and the onset of the Great Recession in late 2007, people began paying off their existing loans while taking out fewer new loans, leading to a decline in overall debt levels.
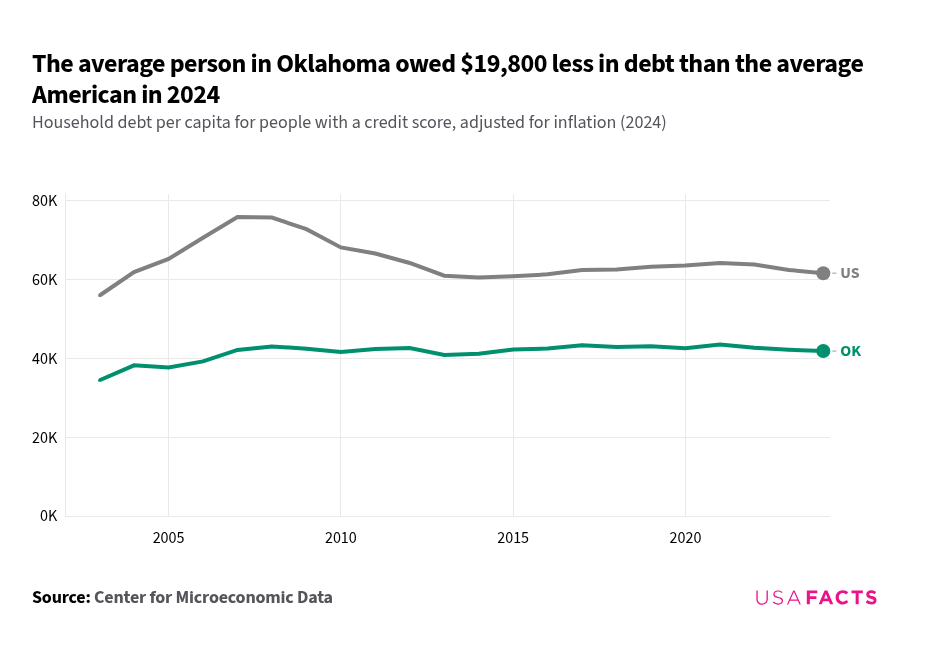
In 2007, during The Great Recession — a debt peak for the US — Oklahoma residents owed around $34,600 less in household debt than the average American. In 2025, they owed around $20,000 less.

The average person in Oklahoma owed $20,000 less in debt than the average American in 2025.

Household debt per capita for people with a credit score, adjusted for inflation (2025)
How much do households in Oklahoma owe in mortgage debt?

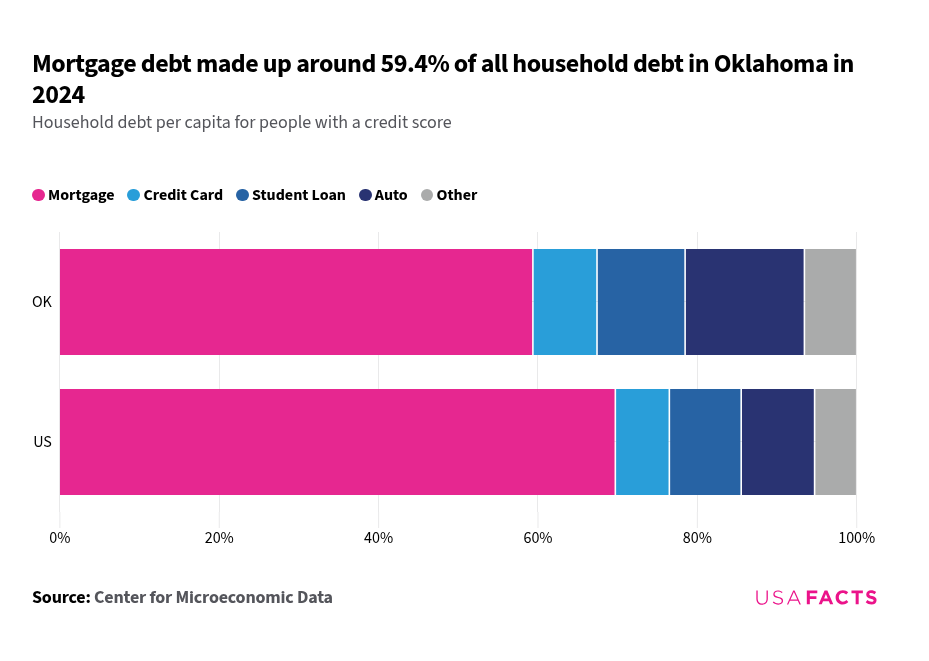
While household debt takes many forms — student loans, auto loans, credit card balances — mortgage debt accounted for around 60.2% of all household debt in Oklahoma in 2025. Mortgages, typically loans taken to purchase homes, are often the largest and longest-term financial commitments for many households. The high cost of housing combined with extended repayment periods (usually five to 30 years) contributes to mortgage debts’ outsized share of overall household debt.

Get weekly insights

Subscribe for data-driven insights. No spin, just the facts.

Mortgage debt made up around 60.2% of all household debt in Oklahoma in 2025.

Household debt per capita for people with a credit score
What is the debt-to-income ratio? How does it vary by county in Oklahoma?

Another important aspect of household debt is the debt-to-income ratio. This ratio compares how much debt a person carries with how much income they earn in a year. If the ratio is greater than 1, it means that, on average, people owe more than they earn annually. This can indicate a heavier financial burden and make it harder to keep up with payments.
Debt-to-income ratios vary from county to county within a state because of differences in income levels, housing costs, and borrowing habits. In 2024, Wagoner County had the highest debt-to-income ratio in the state of 5.81. This means that for every $1 of income earned, the average resident in Wagoner County would owe $5.81. Alternatively, in Cimarron County, residents experience around $0.47 for every $1 of income, the lowest of any county in the state.

Wagoner County, OK had the highest debt to income ratio in Oklahoma in 2024.

Annual household debt, excluding student loans, compared to annual household income
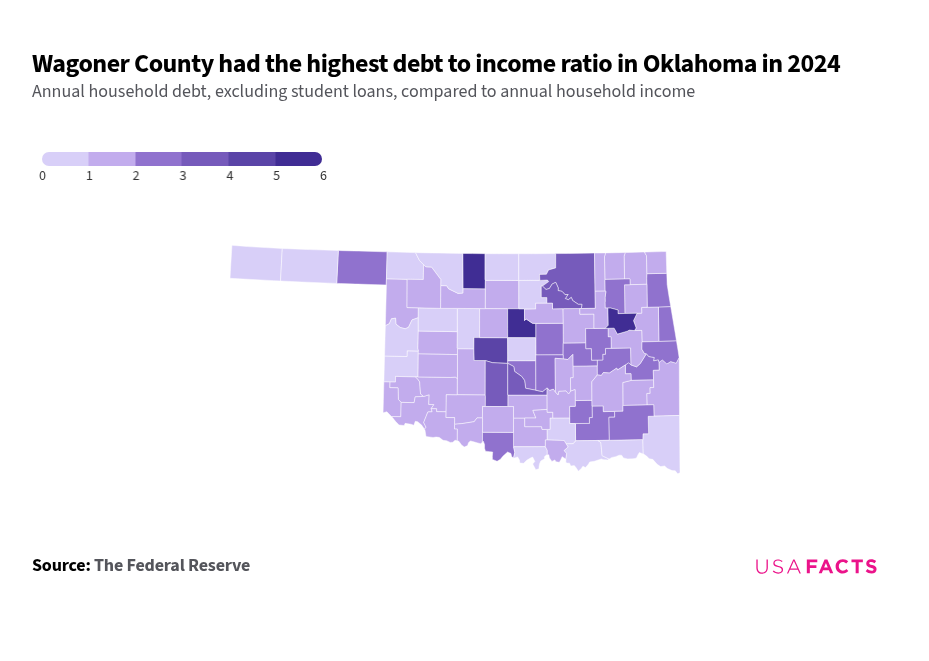
Debt-to-income ratio, by county (2024)

Debt-to-income ratio, by county (2024)
CountyDebt-to-income ratio
1.

Wagoner County, OK

5.8
2.

Alfalfa County, OK

5.5
3.

Logan County, OK

5.5
4.

Canadian County, OK

4.3
5.

Osage County, OK

3.6
6.

Pawnee County, OK

3.5
7.

Grady County, OK

3.0
8.

McClain County, OK

3.0
9.

Atoka County, OK

2.9
10.

Delaware County, OK

2.9

Keep exploring

Methodology

USAFacts standardizes data, in areas such as time and demographics, to make it easier to understand and compare.

Page sources

USAFacts endeavors to share the most up-to-date information available. We sourced the data on this page directly from government agencies; however, the intervals at which agencies publish updated data vary.