How many same-sex married households are in the US?
In 2024, 835,900 US households were led by couples in a same-sex marriage — 1.3% of all households headed by a married couple.
835.9K
1.3%
There are 1.4 million households in the US led by same-sex couples, 60.3% of which are married. The data does not count all couples living together, only relationships to the householder. In other words, not all same-sex marriages are captured in the data, only same-sex married couples that lead a household and are living together.
Thirty-nine states and Washington, DC, legalized same-sex marriage before the Supreme Court’s Obergefell v. Hodges decision recognized same-sex marriage nationwide in 2015. Most of the state-level legalization occurred in 2013 and 2014 when 29 states legalized same-sex marriage. Between 2012 and 2015, the number of households led by married same-sex partners increased by 133.8%.
Get weekly insights
Subscribe for data-driven insights. No spin, just the facts.
How has the number of same-sex households changed since 2015?
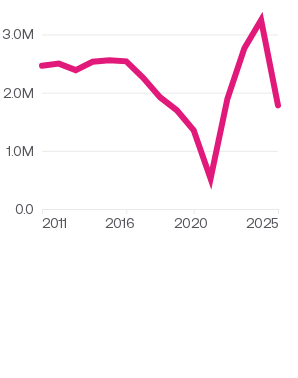
The number of households led by married same-sex couples has increased 96.5% in the years since the Obergefell decision, from 425,400 in 2015 to 835,900 in 2024. In 2016, the number of households headed by same-sex married couples surpassed the number led by unmarried same-sex couples for the first time.
In 2024, 60.3% of US households led by same-sex couples were married couples.
Households led by a same-sex couple by marriage status, 2008–2024

When was same-sex marriage legalized?
States started legalizing same-sex marriage in the mid-2000s.
Massachusetts was the first state to legalize same-sex marriage, in 2004. Other Northeast states followed suit: Connecticut in 2008, Vermont in 2009, and New Hampshire and Washington, DC, in 2010. Iowa also legalized same-sex marriage in 2009, and then 29 other states legalized it between 2013 and 2014.
California legalized same-sex marriage on June 16, 2008. It was then banned on November 4, 2008, when voters passed Proposition 8, a ballot initiative that defined marriage as being between a man and a woman, before legalizing it again in June 2013. Six other states without legal recognition for same-sex marriages — Arkansas, Colorado, Indiana, Michigan, Utah, and Wisconsin — had court actions temporarily allowing same-sex marriages at different points throughout 2014.
By the time same-sex marriage was federally recognized, it was legal in 39 states and Washington, DC.
Before federal legalization in June 2015, same-sex marriage was legal in 39 states and DC.
Legalization of same-sex marriage by year, 2004–2015

Where are same-sex married couple households most common?
As of 2024, the five biggest shares of same-sex married couples out of all households led by married couples were:
- Vermont (2.5% of married couple households were same sex)
- Maine (2.4%)
- Oregon (2.2%)
- Rhode Island (2.2%)
- Massachusetts (2.0%)
States with the lowest share of same sex married households were:
- South Dakota (0.4%)
- Wyoming (0.6%)
- Iowa (0.6%)
- North Dakota (0.6%)
- West Virginia (0.7%)
The share of households headed by married couples that are same-sex was 6.4% in Washington, DC, and 0.6% in Puerto Rico.
Among states, Vermont had the largest share of married households led by couples in a same-sex marriage at 2.5%.
Percentage of married households led by a same-sex couple, 2024

How has the number of same-sex married couple households changed over time?
From 2019 to 2024, the states with the largest percent increases in households headed by same-sex married couples were:
- Rhode Island (+290.4%)
- Hawaii (+164.4%)
- Vermont (+122.2%)
- Alaska (+119.8%)
- Montana (+106.5%)
States with decreases or the smallest increases were:
- Delaware (-9.5%)
- South Dakota (-1.3%)
- Iowa (+8.0%)
- Alabama (+10.7%)
- Arkansas (+14.8%)
The percent change was 22.4% in Washington, DC, and 75.2% in Puerto Rico.
Between 2019 to 2024, the number of households led by couples in a same-sex marriage in Rhode Island grew by 290.4%.
Percent change in married households led by a same-sex couple by state, 2019 to 2024

Households headed by same-sex married couples grew by 47.1% nationwide; up from 568,110 in 2019 to 835,898 in 2024.
How have same-sex marriage households changed over time?
States with larger populations generally had higher numbers of households led by same-sex married couples. In 2024, California had 109,833 households led by same-sex married couples, the most in the nation. California also ranked 1st in total population, with 39.4 million people.
The states with the largest total numbers of households led by same-sex married couples in 2024 were:
- California (109,833)
- Texas (70,167)
- Florida (63,124)
- New York (58,607)
- Pennsylvania (31,335)
Those with the fewest were:
- Wyoming (703)
- South Dakota (754)
- North Dakota (1,011)
- Alaska (1,994)
- Montana (2,214)
There were 5,280 households led by couples in a same-sex marriage in Washington, DC, and 2,670 in Puerto Rico.
In 2024, the most households led by couples in a same-sex marriage were living in California and Texas.
Married households led by a same-sex couple, 2019 and 2024

How is the US population changing?
Keep exploring
- Is the US population growing or shrinking?
- Semiquincentennial snapshot: the US at 250 years - Insights about the nation's population, households, education, employment, and income.
- How have American households changed over time? - In 2023, single-parent households reached their lowest share since 1977.
- Which US cities have the largest homeless populations? - In 2025, over a quarter of people experiencing homelessness in the US were concentrated in two major cities: New York, NY, and Los Angeles, CA.
Methodology
USAFacts standardizes data, in areas such as time and demographics, to make it easier to understand and compare.
Page sources
USAFacts endeavors to share the most up-to-date information available. We sourced the data on this page directly from government agencies; however, the intervals at which agencies publish updated data vary.

