How many civilian jobs are in the US federal government?
2.7M
1.7%
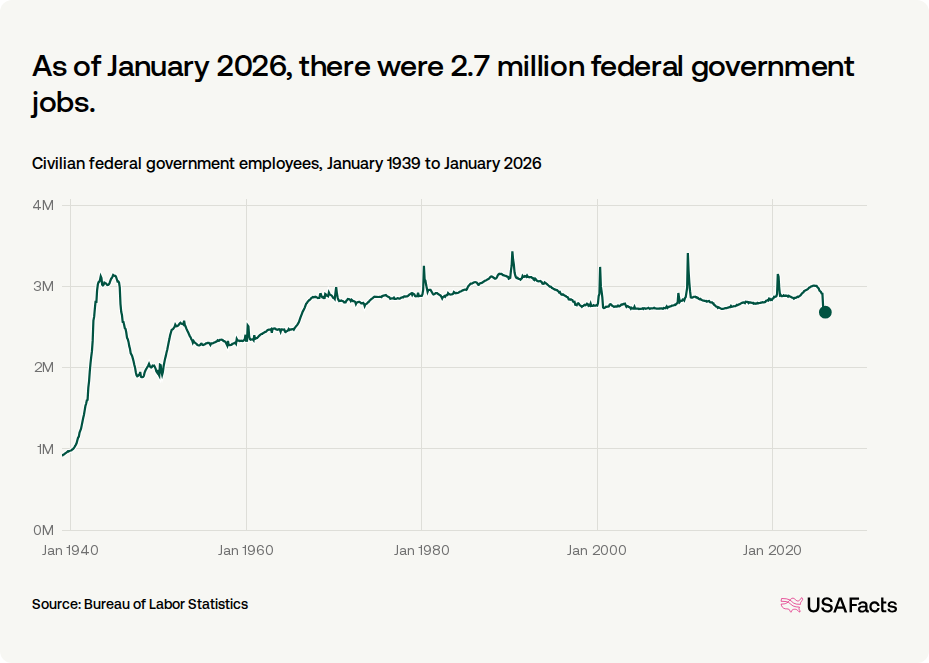
As of September 2026, there were 2.7 million federal government jobs.
Civilian federal government employees, January 1939 to September 2026
What share of all civilian jobs are in the federal government?
Get weekly insights
Subscribe for data-driven insights. No spin, just the facts.
As of September 2026, 1.7% of jobs in the US were in the federal government.
Civilian federal government share of nonfarm employment, January 1939 to September 2026

Which federal agencies employ the most civilians?
In August 2026, the Department of Defense accounted for more federal workers than any other agency.
Civilian federal personnel, primarily in executive branch, as of August 2026

Which states have the highest share of federal government jobs?
5% of the jobs in Hawaii are in the federal government, more than any other state.
Civilian federal government employees (including postal workers) share of nonfarm employment August 2026
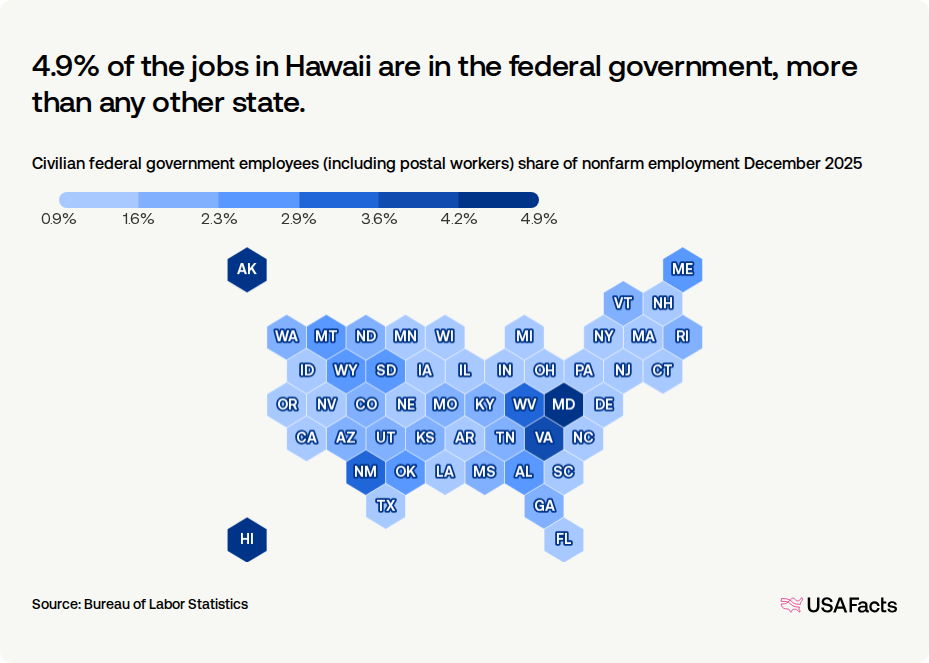
Civilian federal government employees (including postal workers) share of nonfarm employment, by state (August 2026)
| State | Share of workers in the federal government |
|---|---|
Washington, DC | 22.8% |
Hawaii | 5.0% |
Maryland | 4.7% |
Virginia | 4.0% |
Alaska | 3.9% |
West Virginia | 3.3% |
New Mexico | 2.9% |
Oklahoma | 2.7% |
Maine | 2.6% |
Wyoming | 2.5% |
Keep exploring

Methodology
USAFacts standardizes data, in areas such as time and demographics, to make it easier to understand and compare.
Page sources
USAFacts endeavors to share the most up-to-date information available. We sourced the data on this page directly from government agencies; however, the intervals at which agencies publish updated data vary.

