How are public schools in the US funded?
Refreshed annually
Public schools are funded primarily from state and local governments. In the 2022–2023 school year, the most recent year of available data, about 45.1% of public school funding came from state sources like income and retail taxes, and another 42% came from local sources like property taxes. The federal government provided the remaining 12.9%, often through programs like Title I or IDEA that are aimed at supporting specific student needs. Altogether, public schools received $981.8 billion in funding, or $19,900 per student.
$982B
of funding went to public schools in the US (2022–2023 school year)
$19.9K
per student went to public schools in the US (2022–2023 school year)
This mix of funding sources has remained fairly consistent over the past decade, with state and local governments contributing the majority each year. However, changes in policy or administration at any level of government can influence the total amount of funding that public schools receive.
In the 2022–2023 school year, around 45.1% of public school funding came from states.
Total funding by source per student, adjusted for inflation

Where do local, state, and federal funds come from?
Public school districts receive funding from a combination of local, state, and federal sources.
- Local funding often comes from property taxes but can also come from fees or programs like parent-teacher associations.
- State funding is generated through a wide variety of sources that vary from state-to-state, often through personal and corporate income and retail sales taxes. Depending on the state, funding may also come from taxes on tobacco products and alcoholic beverages and from lotteries.
- Federal funding often comes to school districts through a series of targeted grants, like Title I, which supports schools serving low-income communities, or IDEA, which funds special education services. Much of this funding goes to the state, which is then allocated to individual school districts.
Get weekly insights
Subscribe for data-driven insights. No spin, just the facts.
In the 2022–2023 school year, local, state, and federal funds amounted to $19,900 per student
Total public school funding by source per student

Which states have the most funding per student? Which states have the least?
National averages paint an overall picture of school funding but mask large differences across states. Each state sets its own approach to funding public education and distributing those funds, so per-student funding can vary widely—from around $12,000 in Idaho to $36,600 in Washington, DC.
These differences reflect a mix of factors, including cost of living, how much funding is collected at the state versus local level, and local tax bases; property values and tax policies vary across the country, impacting the funding available to public schools.
DC schools received $36,600 per student in the 2022–2023 school year, the most of any state
Total public school funding per student, all sources

What is the local, state and federal funding breakdown for each state?
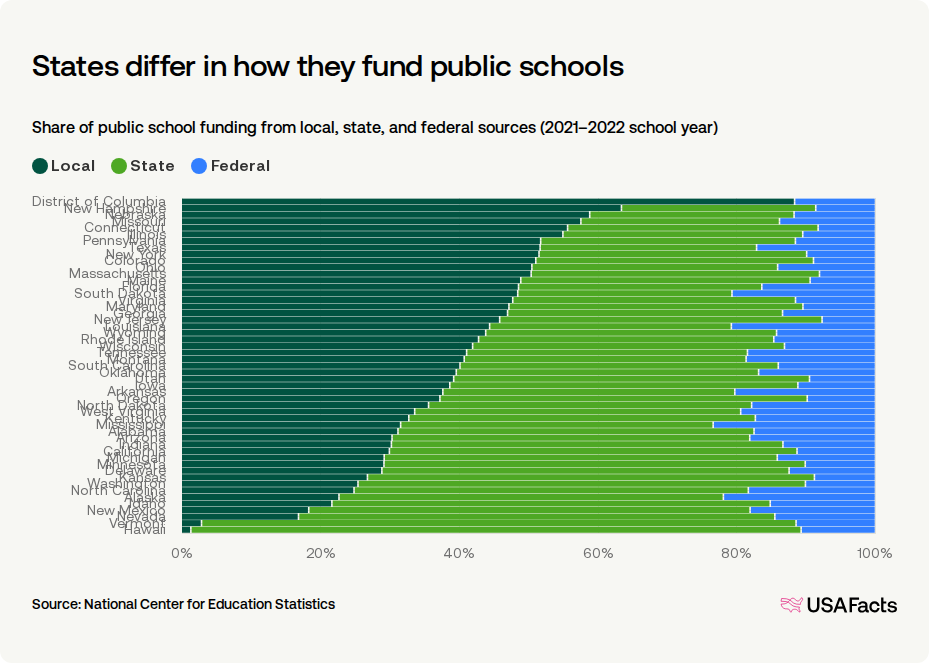
States also differ in the percentage of funding coming from state versus local sources. In Hawaii, 88% of school funding came from state sources; in New Hampshire, local sources accounted for 63.4% of total funding. In other states like Mississippi, where there are fewer local revenues, federal dollars made up a larger portion — about 23.4% of total funding.
States differ in how they fund public schools
Share of public school funding from local, state, and federal sources (2021–2022 school year)
Total public school funding per student, by state (2022–2023 school year)
| State | Funding per student |
|---|---|
Washington, DC | $36,600 |
New York | $34,800 |
New Jersey | $30,000 |
Connecticut | $26,900 |
Vermont | $26,500 |
Hawaii | $25,500 |
Rhode Island | $25,000 |
Massachusetts | $25,000 |
Illinois | $24,800 |
California | $24,700 |
Keep exploring
Methodology
USAFacts standardizes data, in areas such as time and demographics, to make it easier to understand and compare.
Page sources
USAFacts endeavors to share the most up-to-date information available. We sourced the data on this page directly from government agencies; however, the intervals at which agencies publish updated data vary.
